> ## Documentation Index
> Fetch the complete documentation index at: https://telr-docs.cashfree.com/llms.txt
> Use this file to discover all available pages before exploring further.
# Configuration
> Learn how to configure webhook, logs, analytics, and service alerts.
Add and define webhooks for Payment Gateway, Payment Links, Payment Forms and Subscriptions. Get notified for each action on the URLs configured.
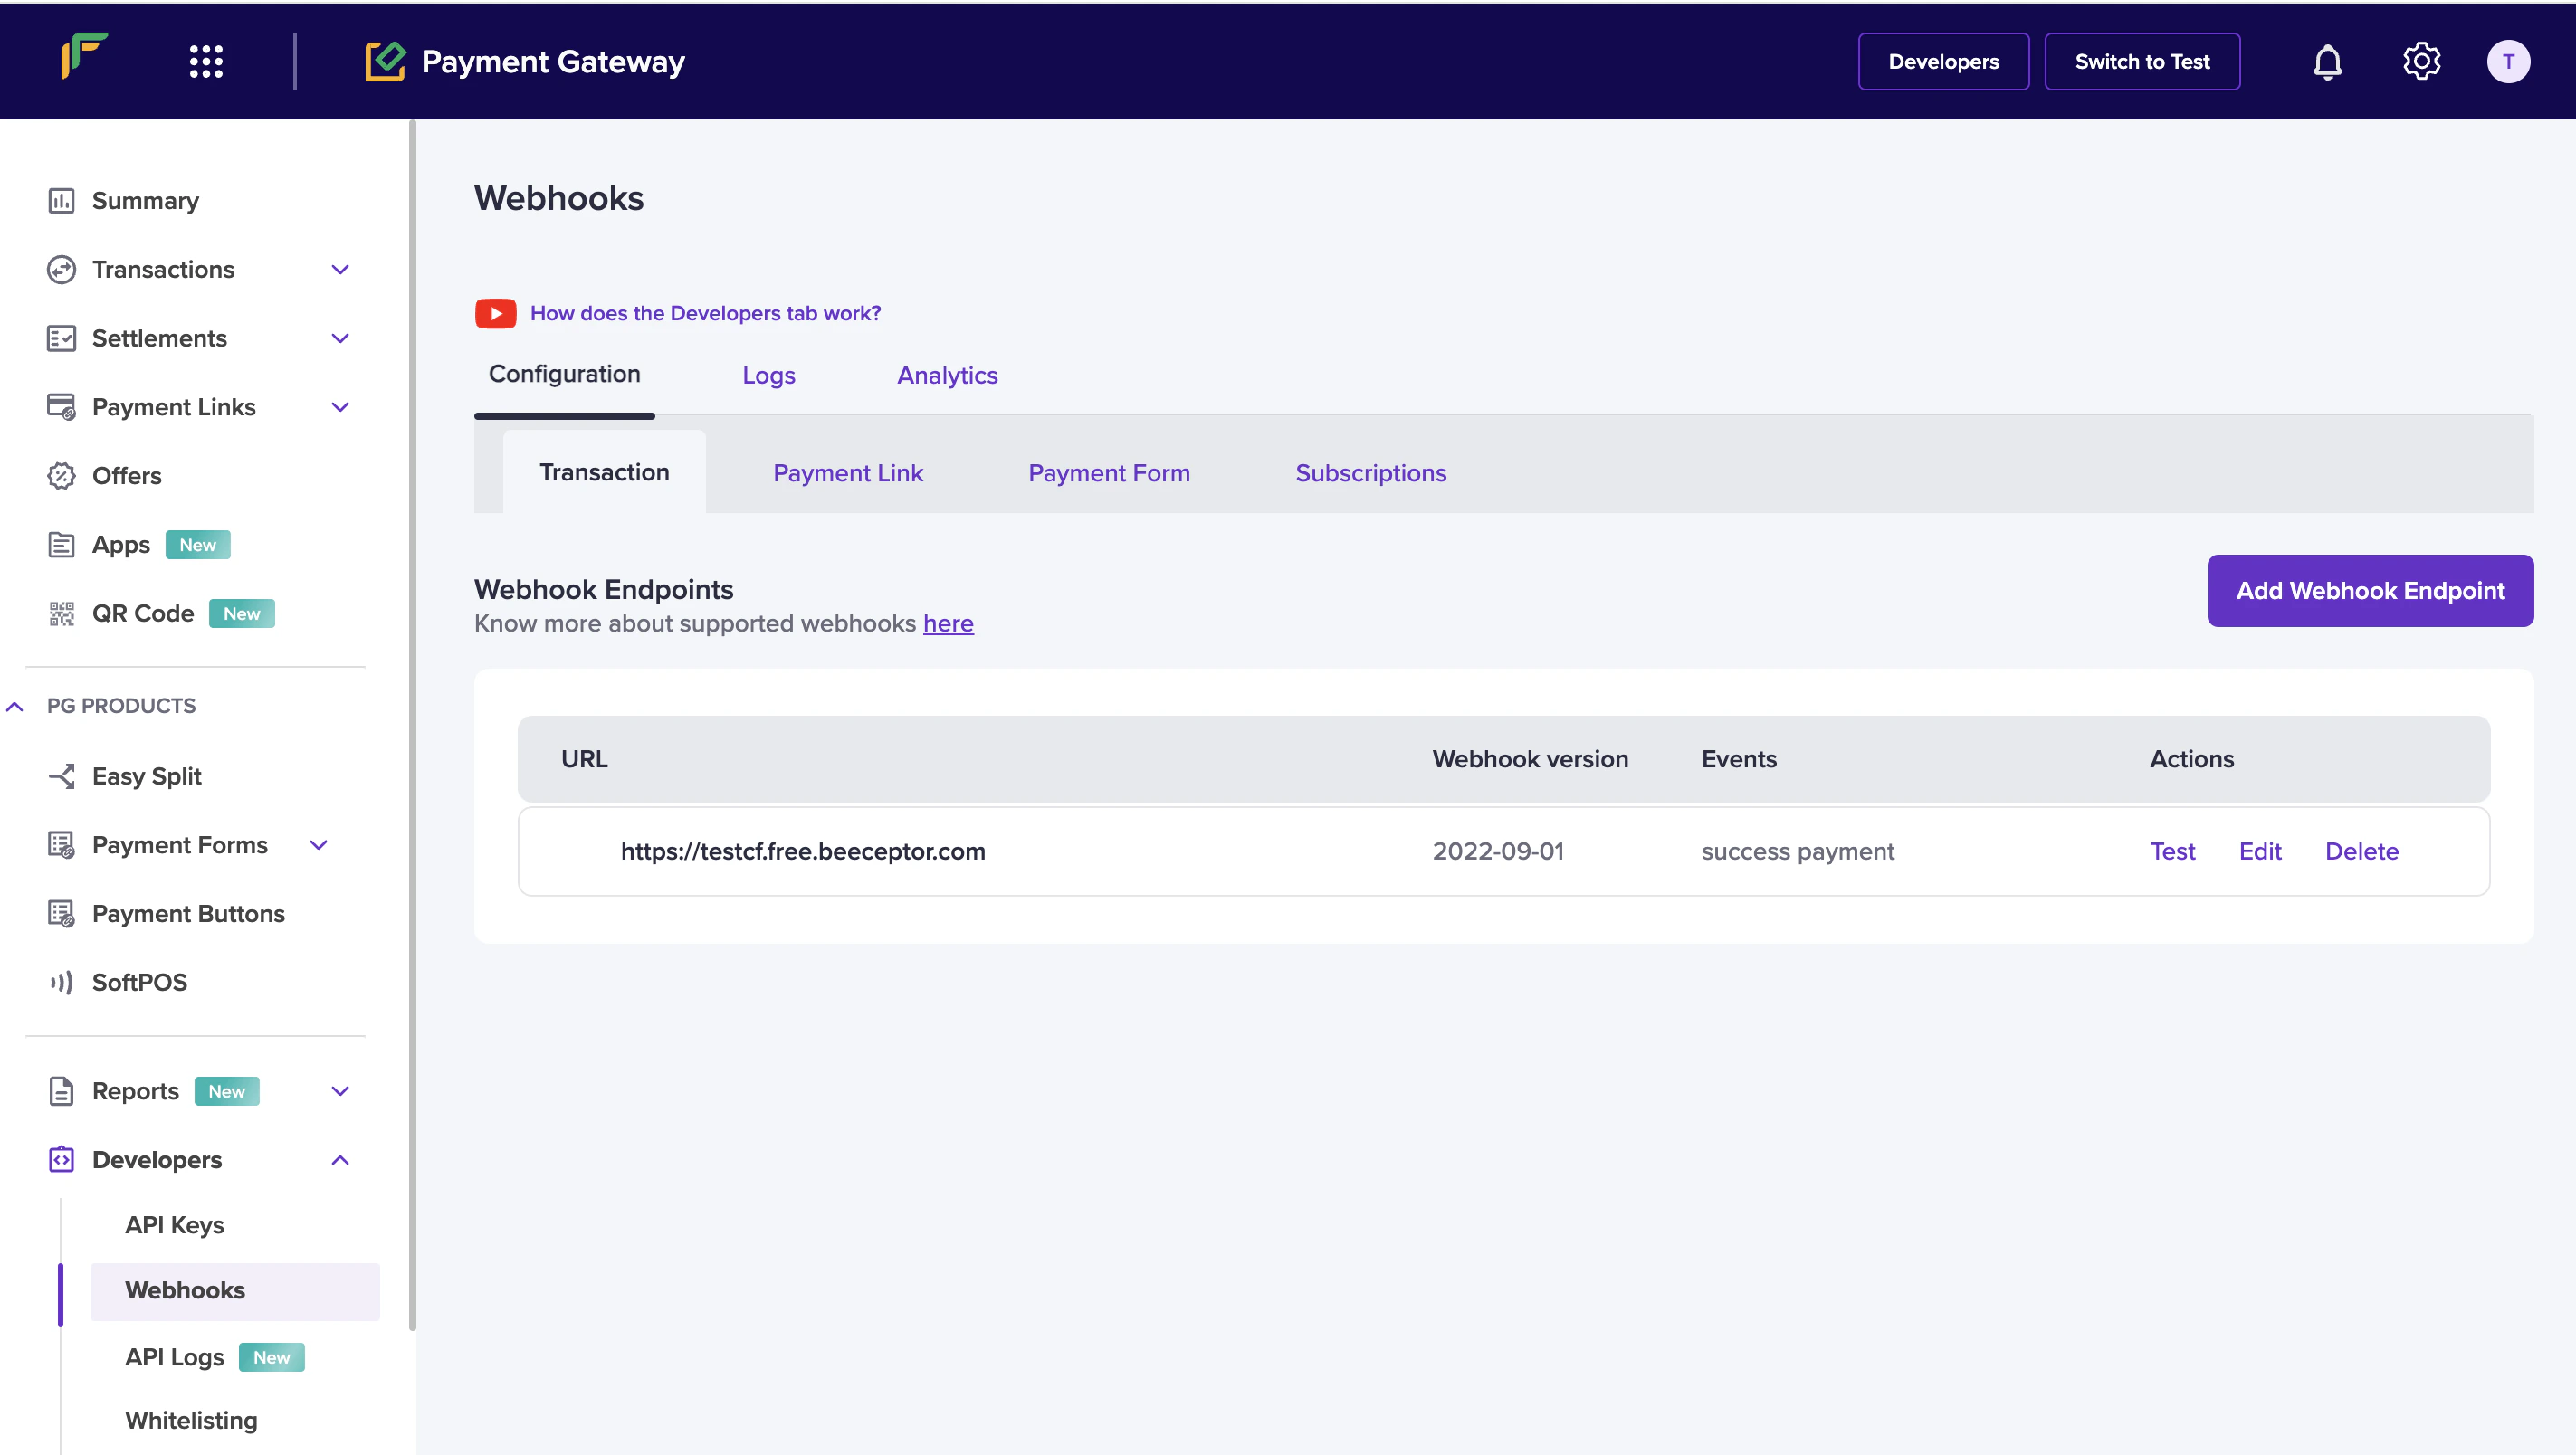 ***
### Add webhook endpoint
To add a new webhook,
1. Go to **Payment Gateway Dashboard** > **Developers** or click the **Developers** option from the homepage.
2. Click **Add Webhook Endpoint** to create a new webhook. Enter the endpoint URL and select the webhook version using the drop-down menu. The available webhook versions are: 2022-09-01, 2023-08-01. Click on **Test** to verify if the webhook endpoint returns a response. Once done, click **Next**.
***
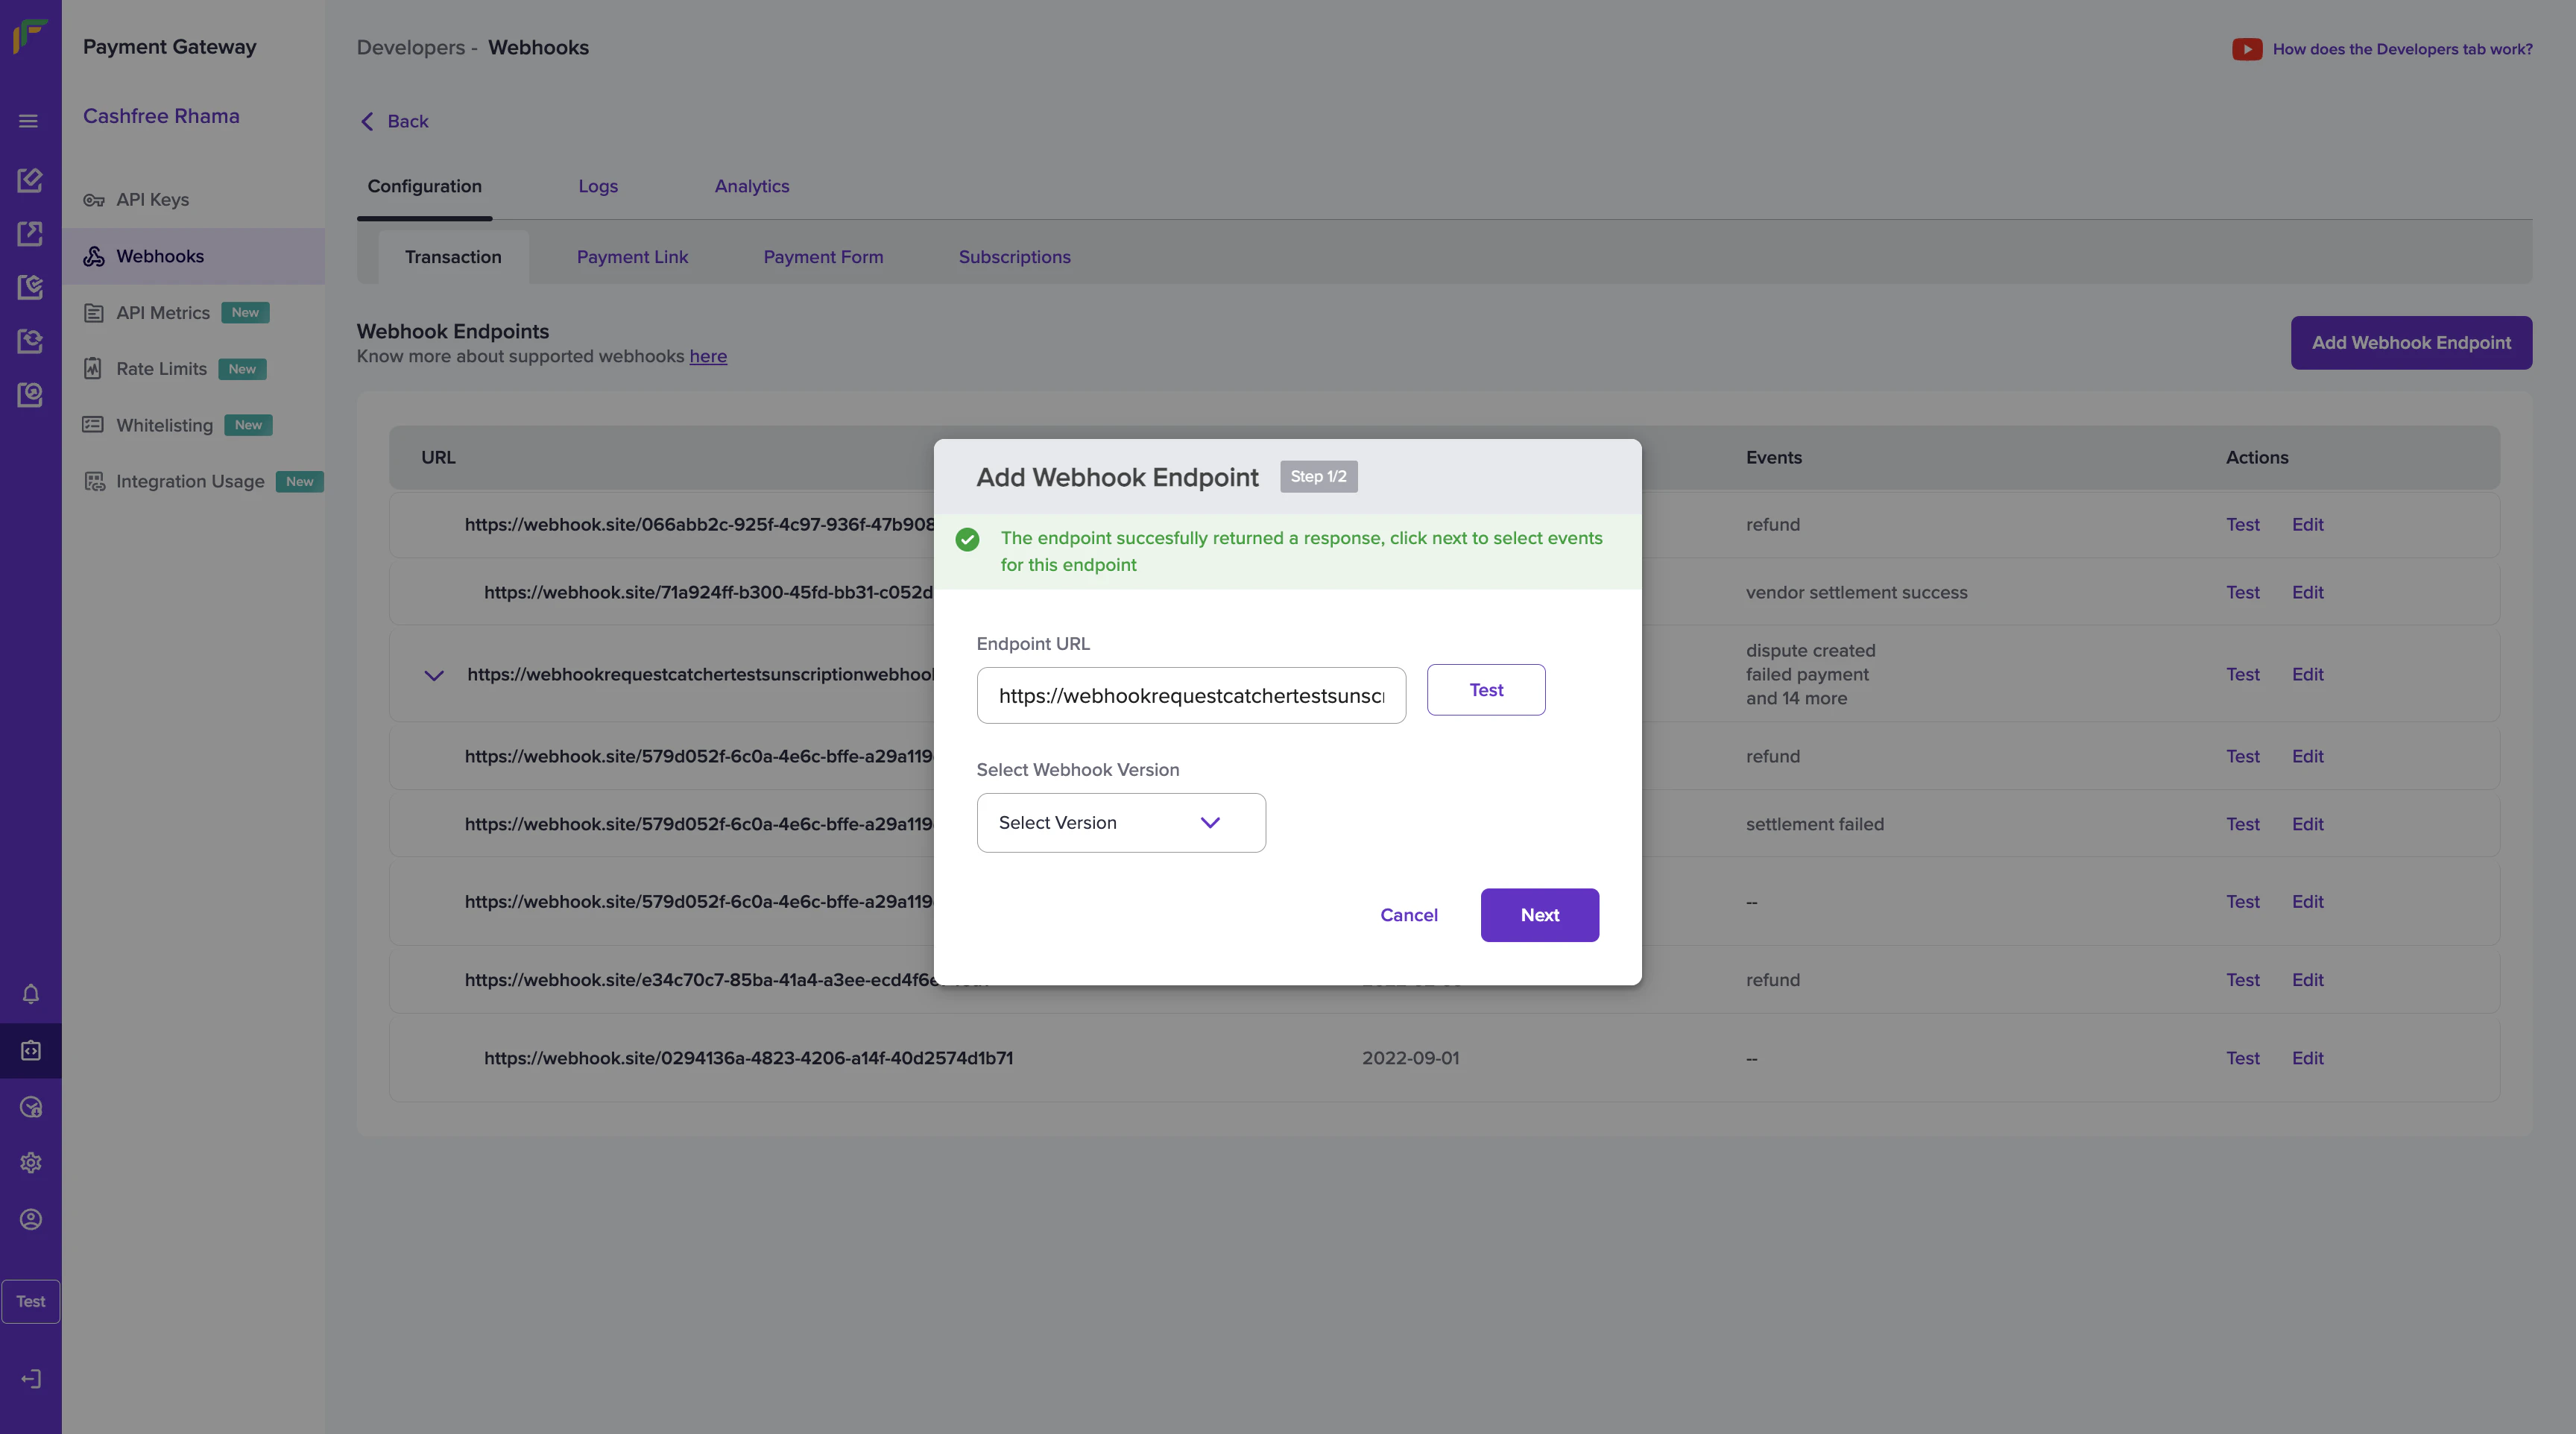
### Add webhook endpoint
To add a new webhook,
1. Go to **Payment Gateway Dashboard** > **Developers** or click the **Developers** option from the homepage.
2. Click **Add Webhook Endpoint** to create a new webhook. Enter the endpoint URL and select the webhook version using the drop-down menu. The available webhook versions are: 2022-09-01, 2023-08-01. Click on **Test** to verify if the webhook endpoint returns a response. Once done, click **Next**.
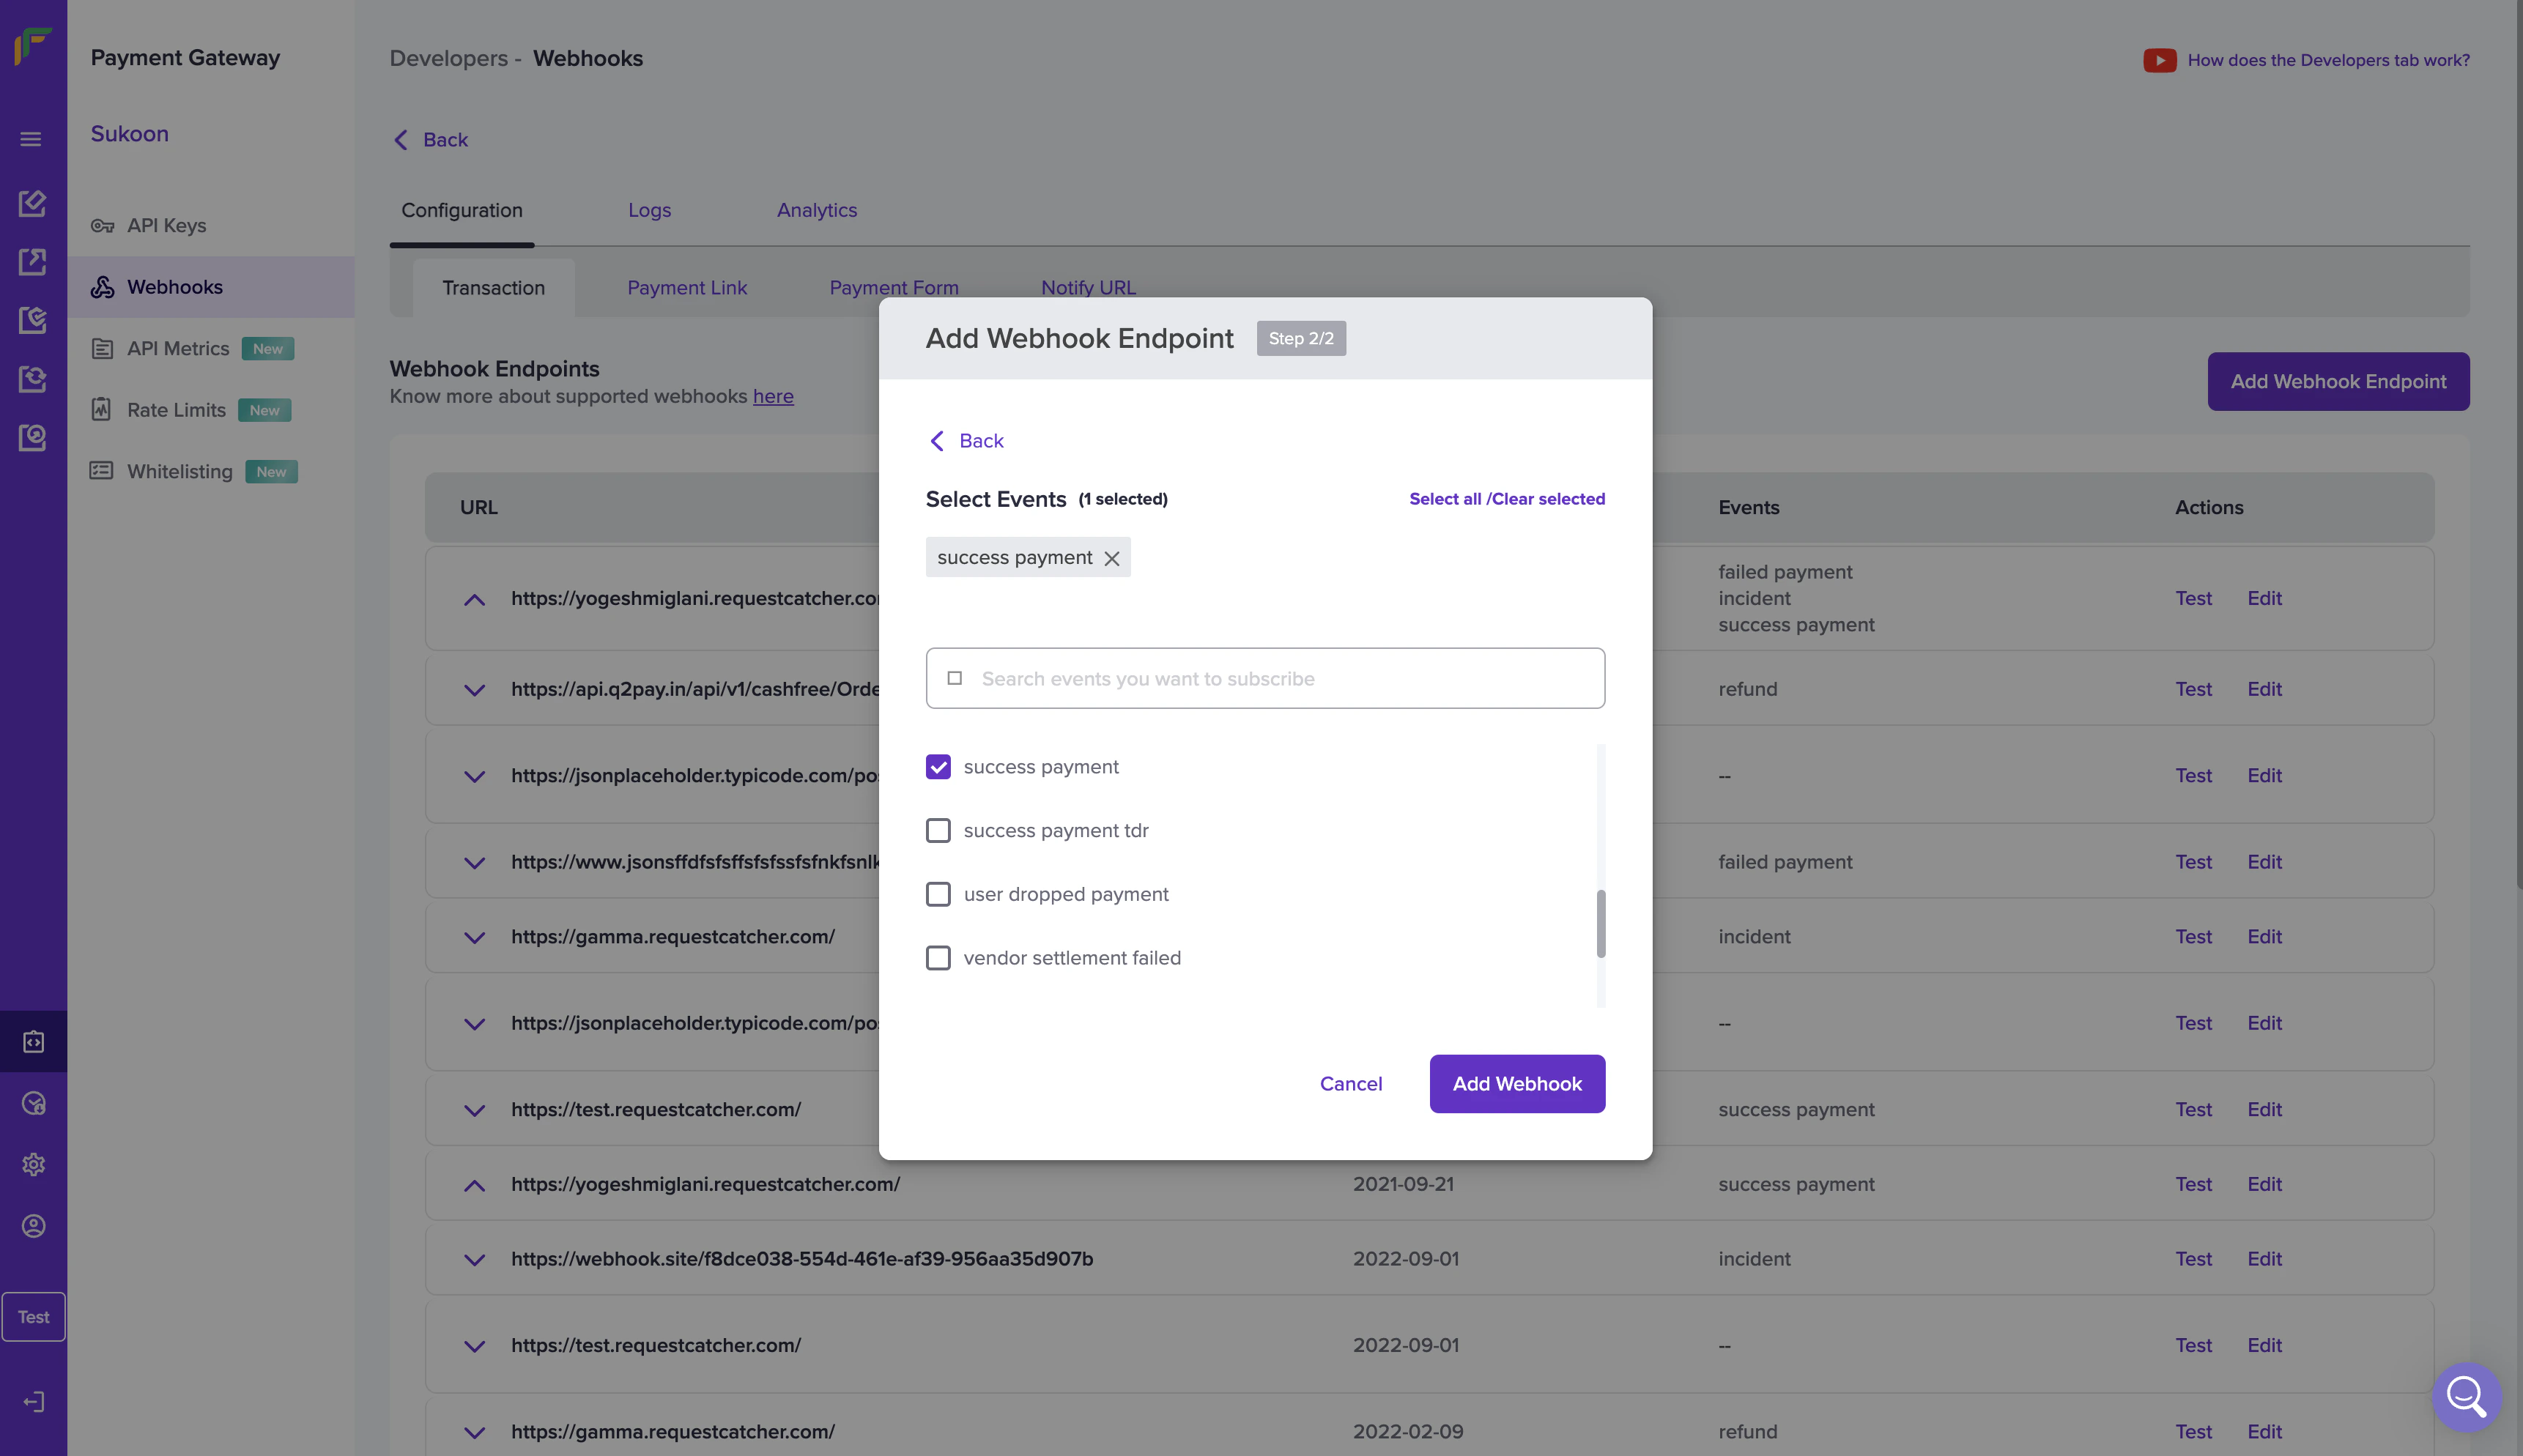
 3. Select the events for which you want to configure the webhooks and click **Add Webhook**. The available events are:
* dispute closed
* dispute created
* dispute updated
* failed payment
* incident
* instrument active
* instrument failed
* refund
* settlement failed
* settlement initiated
* settlement reversed
* success payment
* success payment tdr
* user dropped payment
* vendor settlement failed
* vendor settlement initiated
* vendor settlement reversed
* vendor settlement success
3. Select the events for which you want to configure the webhooks and click **Add Webhook**. The available events are:
* dispute closed
* dispute created
* dispute updated
* failed payment
* incident
* instrument active
* instrument failed
* refund
* settlement failed
* settlement initiated
* settlement reversed
* success payment
* success payment tdr
* user dropped payment
* vendor settlement failed
* vendor settlement initiated
* vendor settlement reversed
* vendor settlement success
 You have successfully created a webhook for the required event. You can view all your webhooks from the Webhook Enpoints homepage. Details such as URL, webhook version, event, and actions are available.
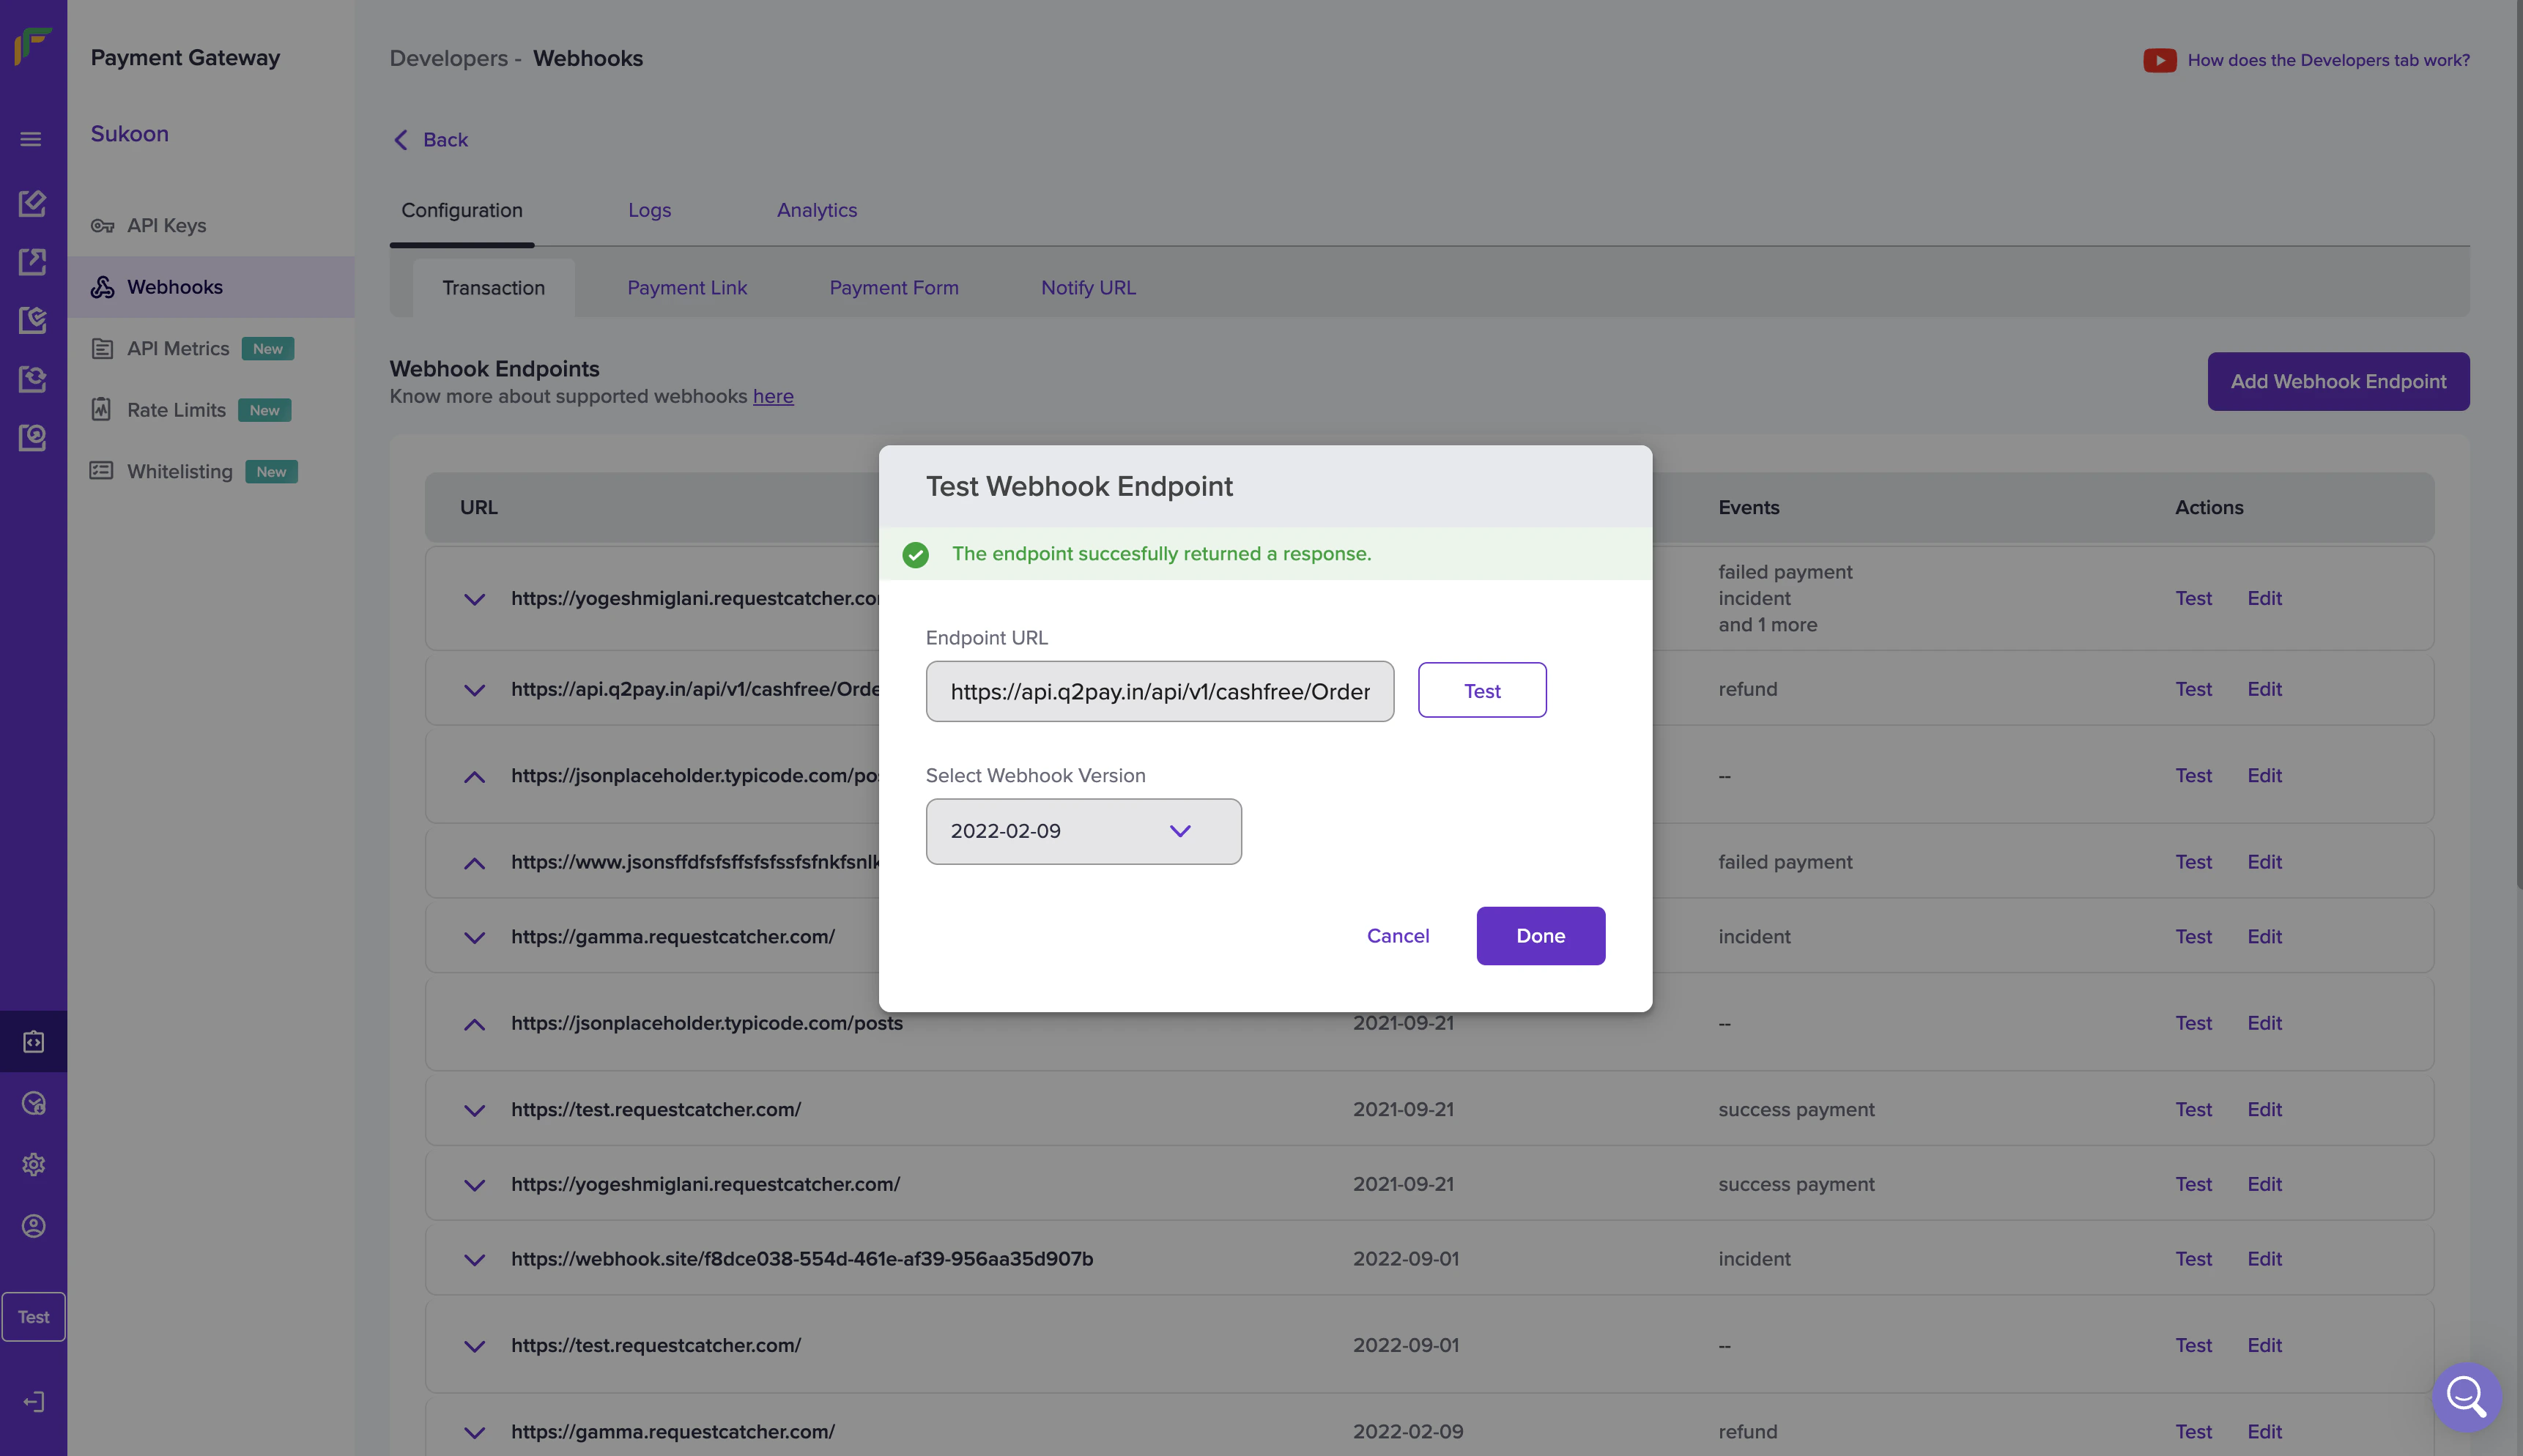
### Test webhook endpoint
You can test the URL at any time using the **Test** option. Click the Test option in the **Test Webhook Endpoint** pop-up. Click **Done** once you get a success response.
You have successfully created a webhook for the required event. You can view all your webhooks from the Webhook Enpoints homepage. Details such as URL, webhook version, event, and actions are available.
### Test webhook endpoint
You can test the URL at any time using the **Test** option. Click the Test option in the **Test Webhook Endpoint** pop-up. Click **Done** once you get a success response.
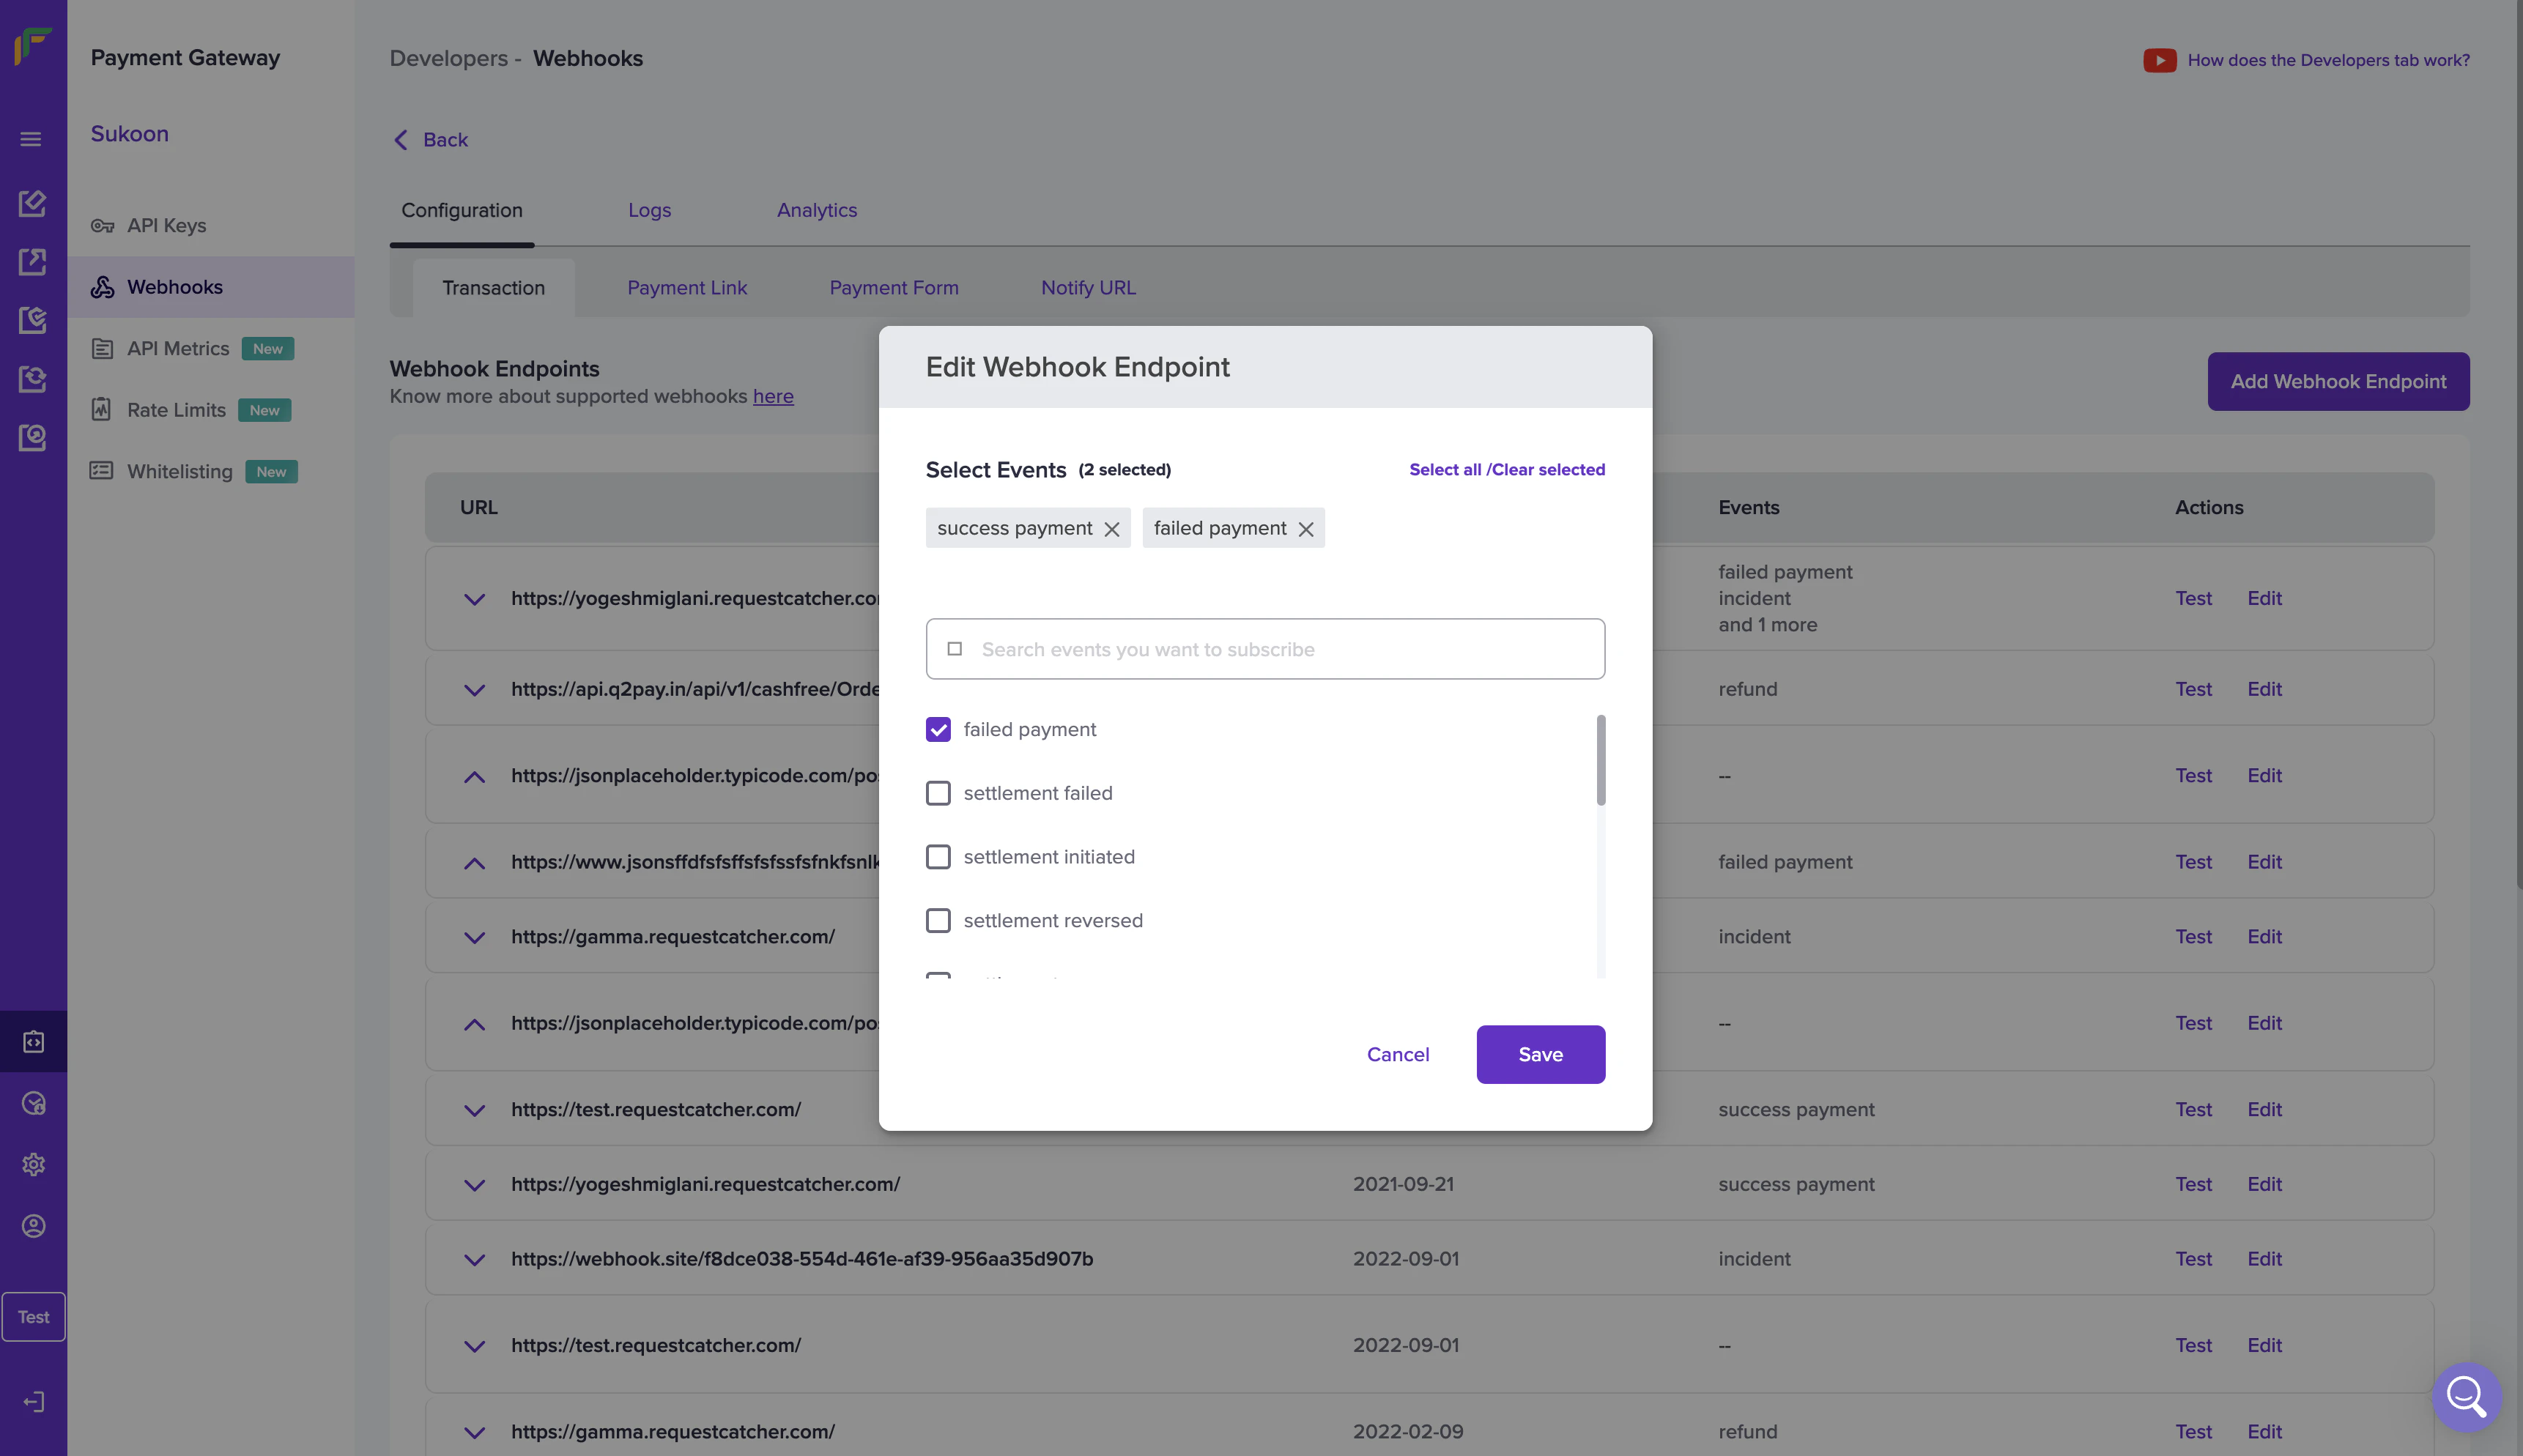
 ### Edit webhook endpoint
You also have the option of editing a webhook. Click the **Edit** option on the webhook that is to be edited and select the events you want to add/remove to the webhook. Once done click **Save**.
### Edit webhook endpoint
You also have the option of editing a webhook. Click the **Edit** option on the webhook that is to be edited and select the events you want to add/remove to the webhook. Once done click **Save**.
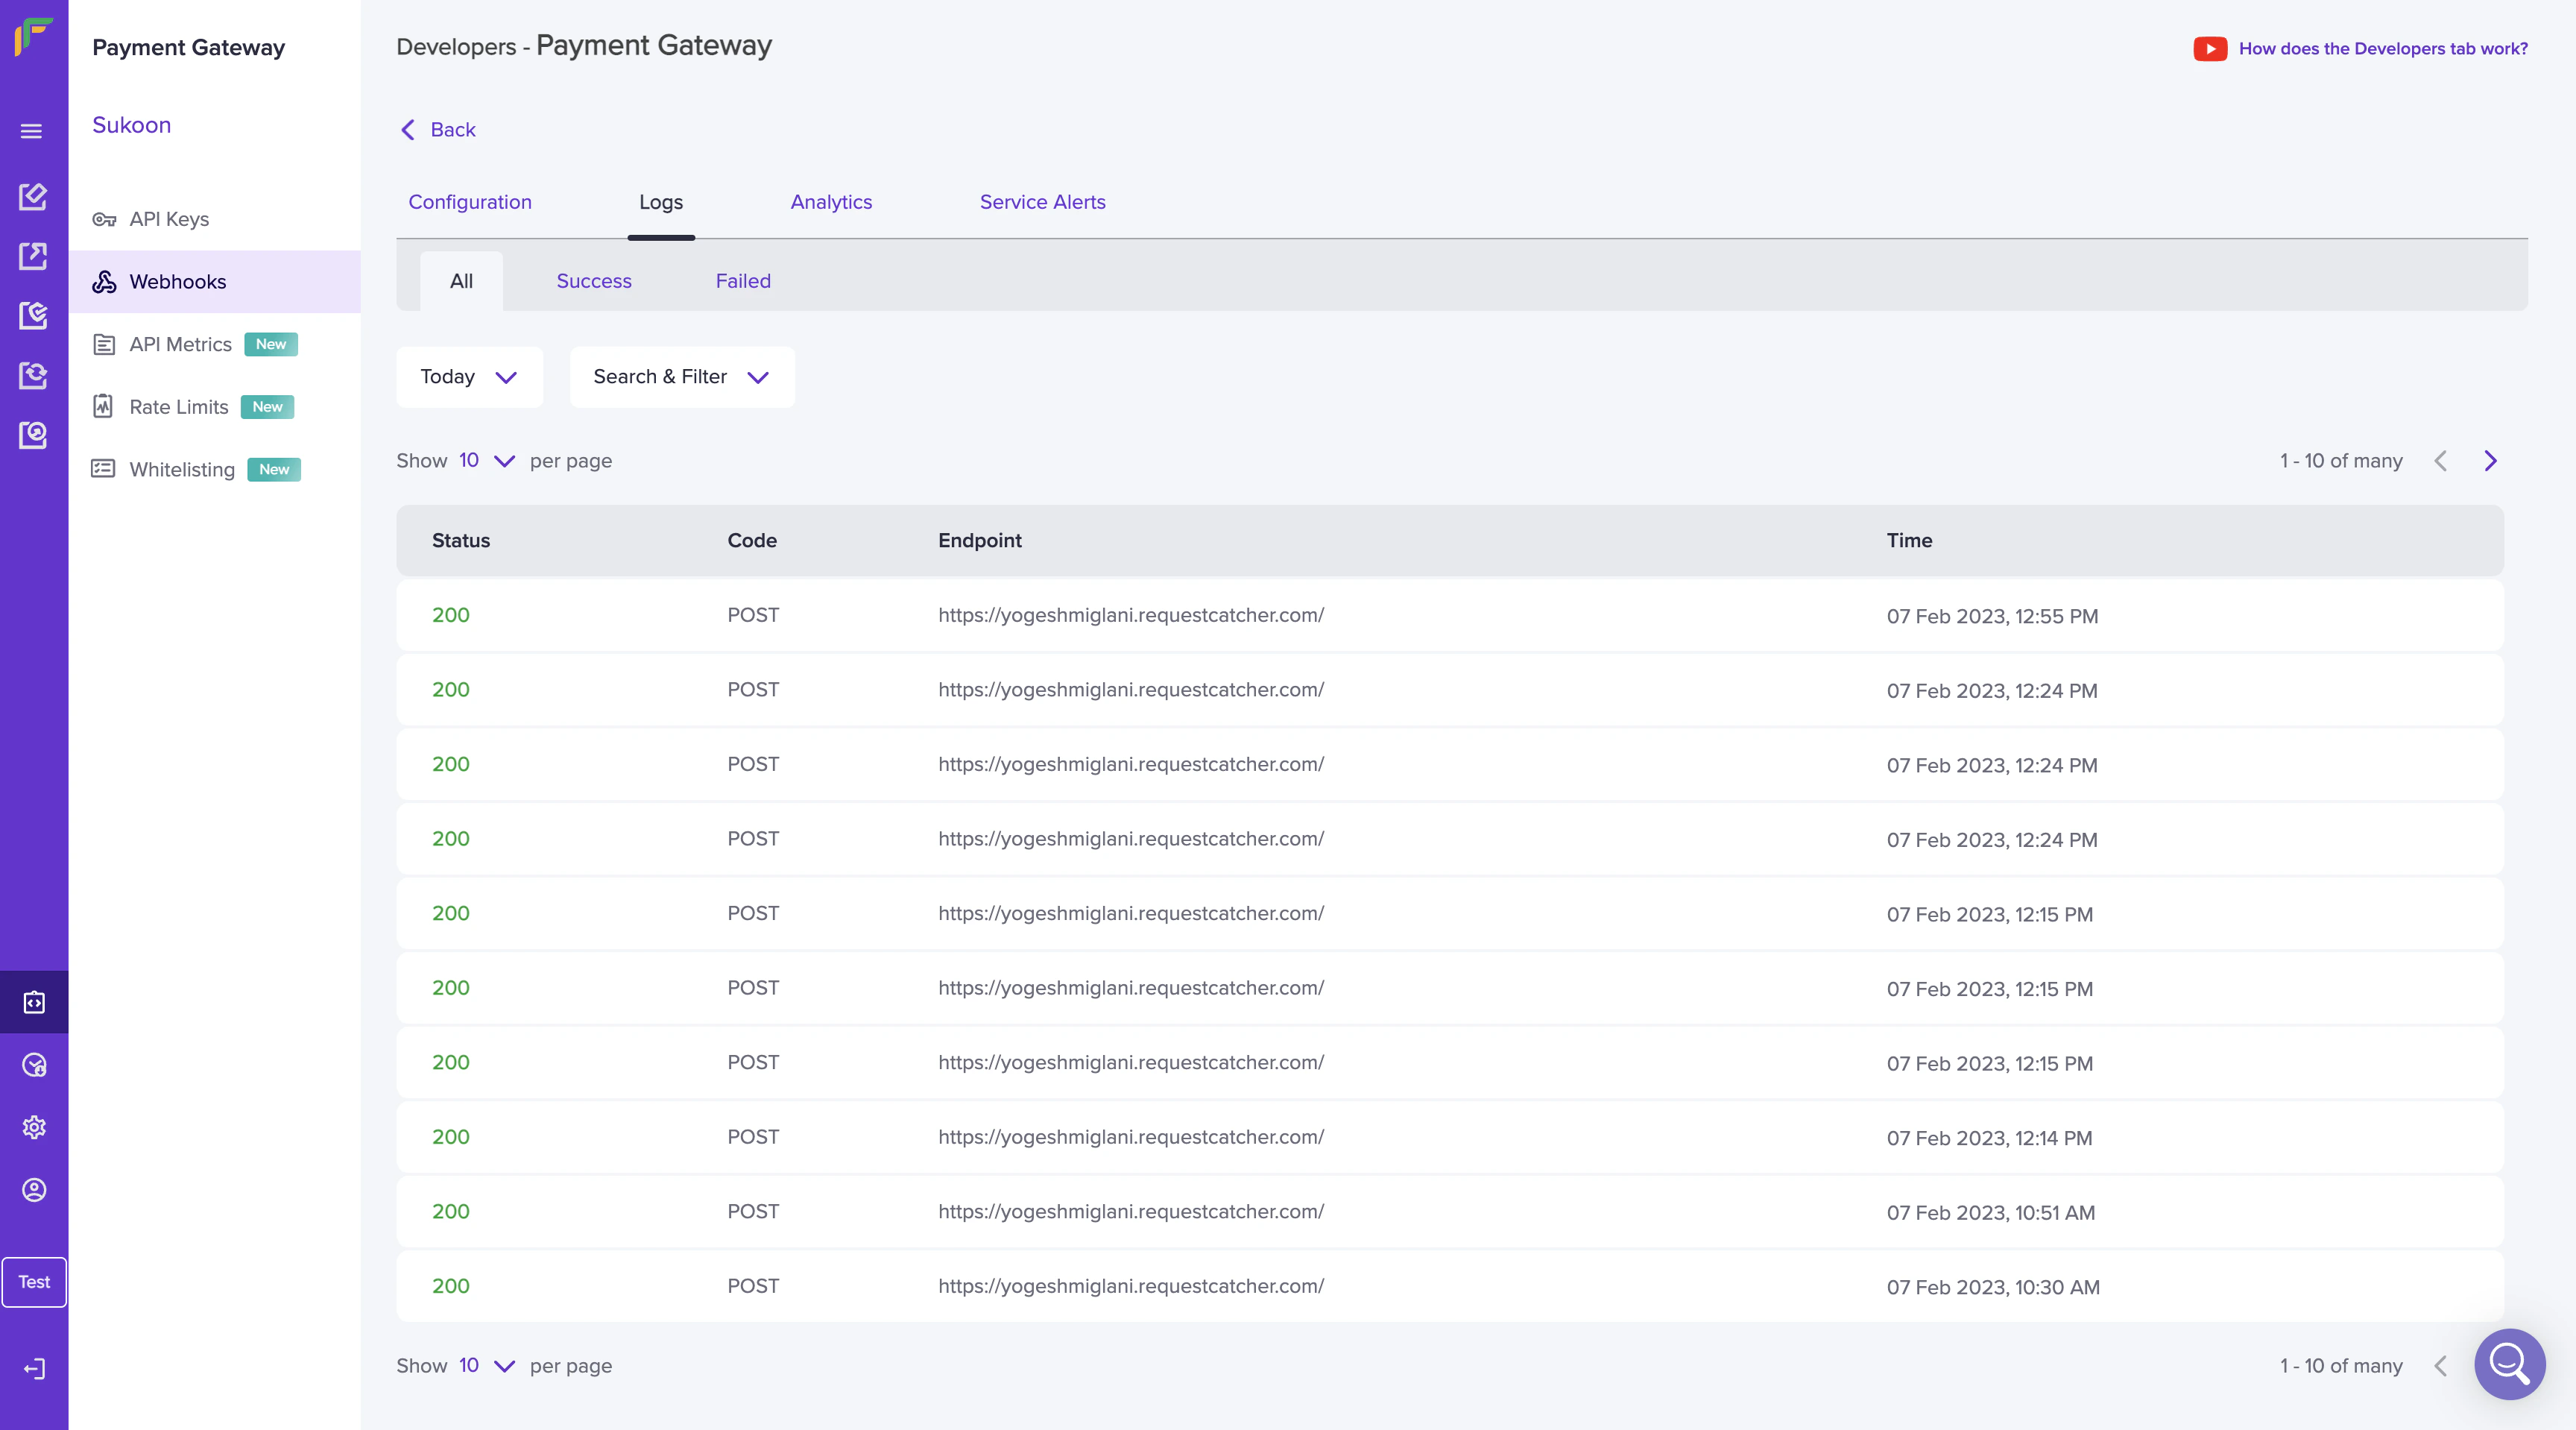
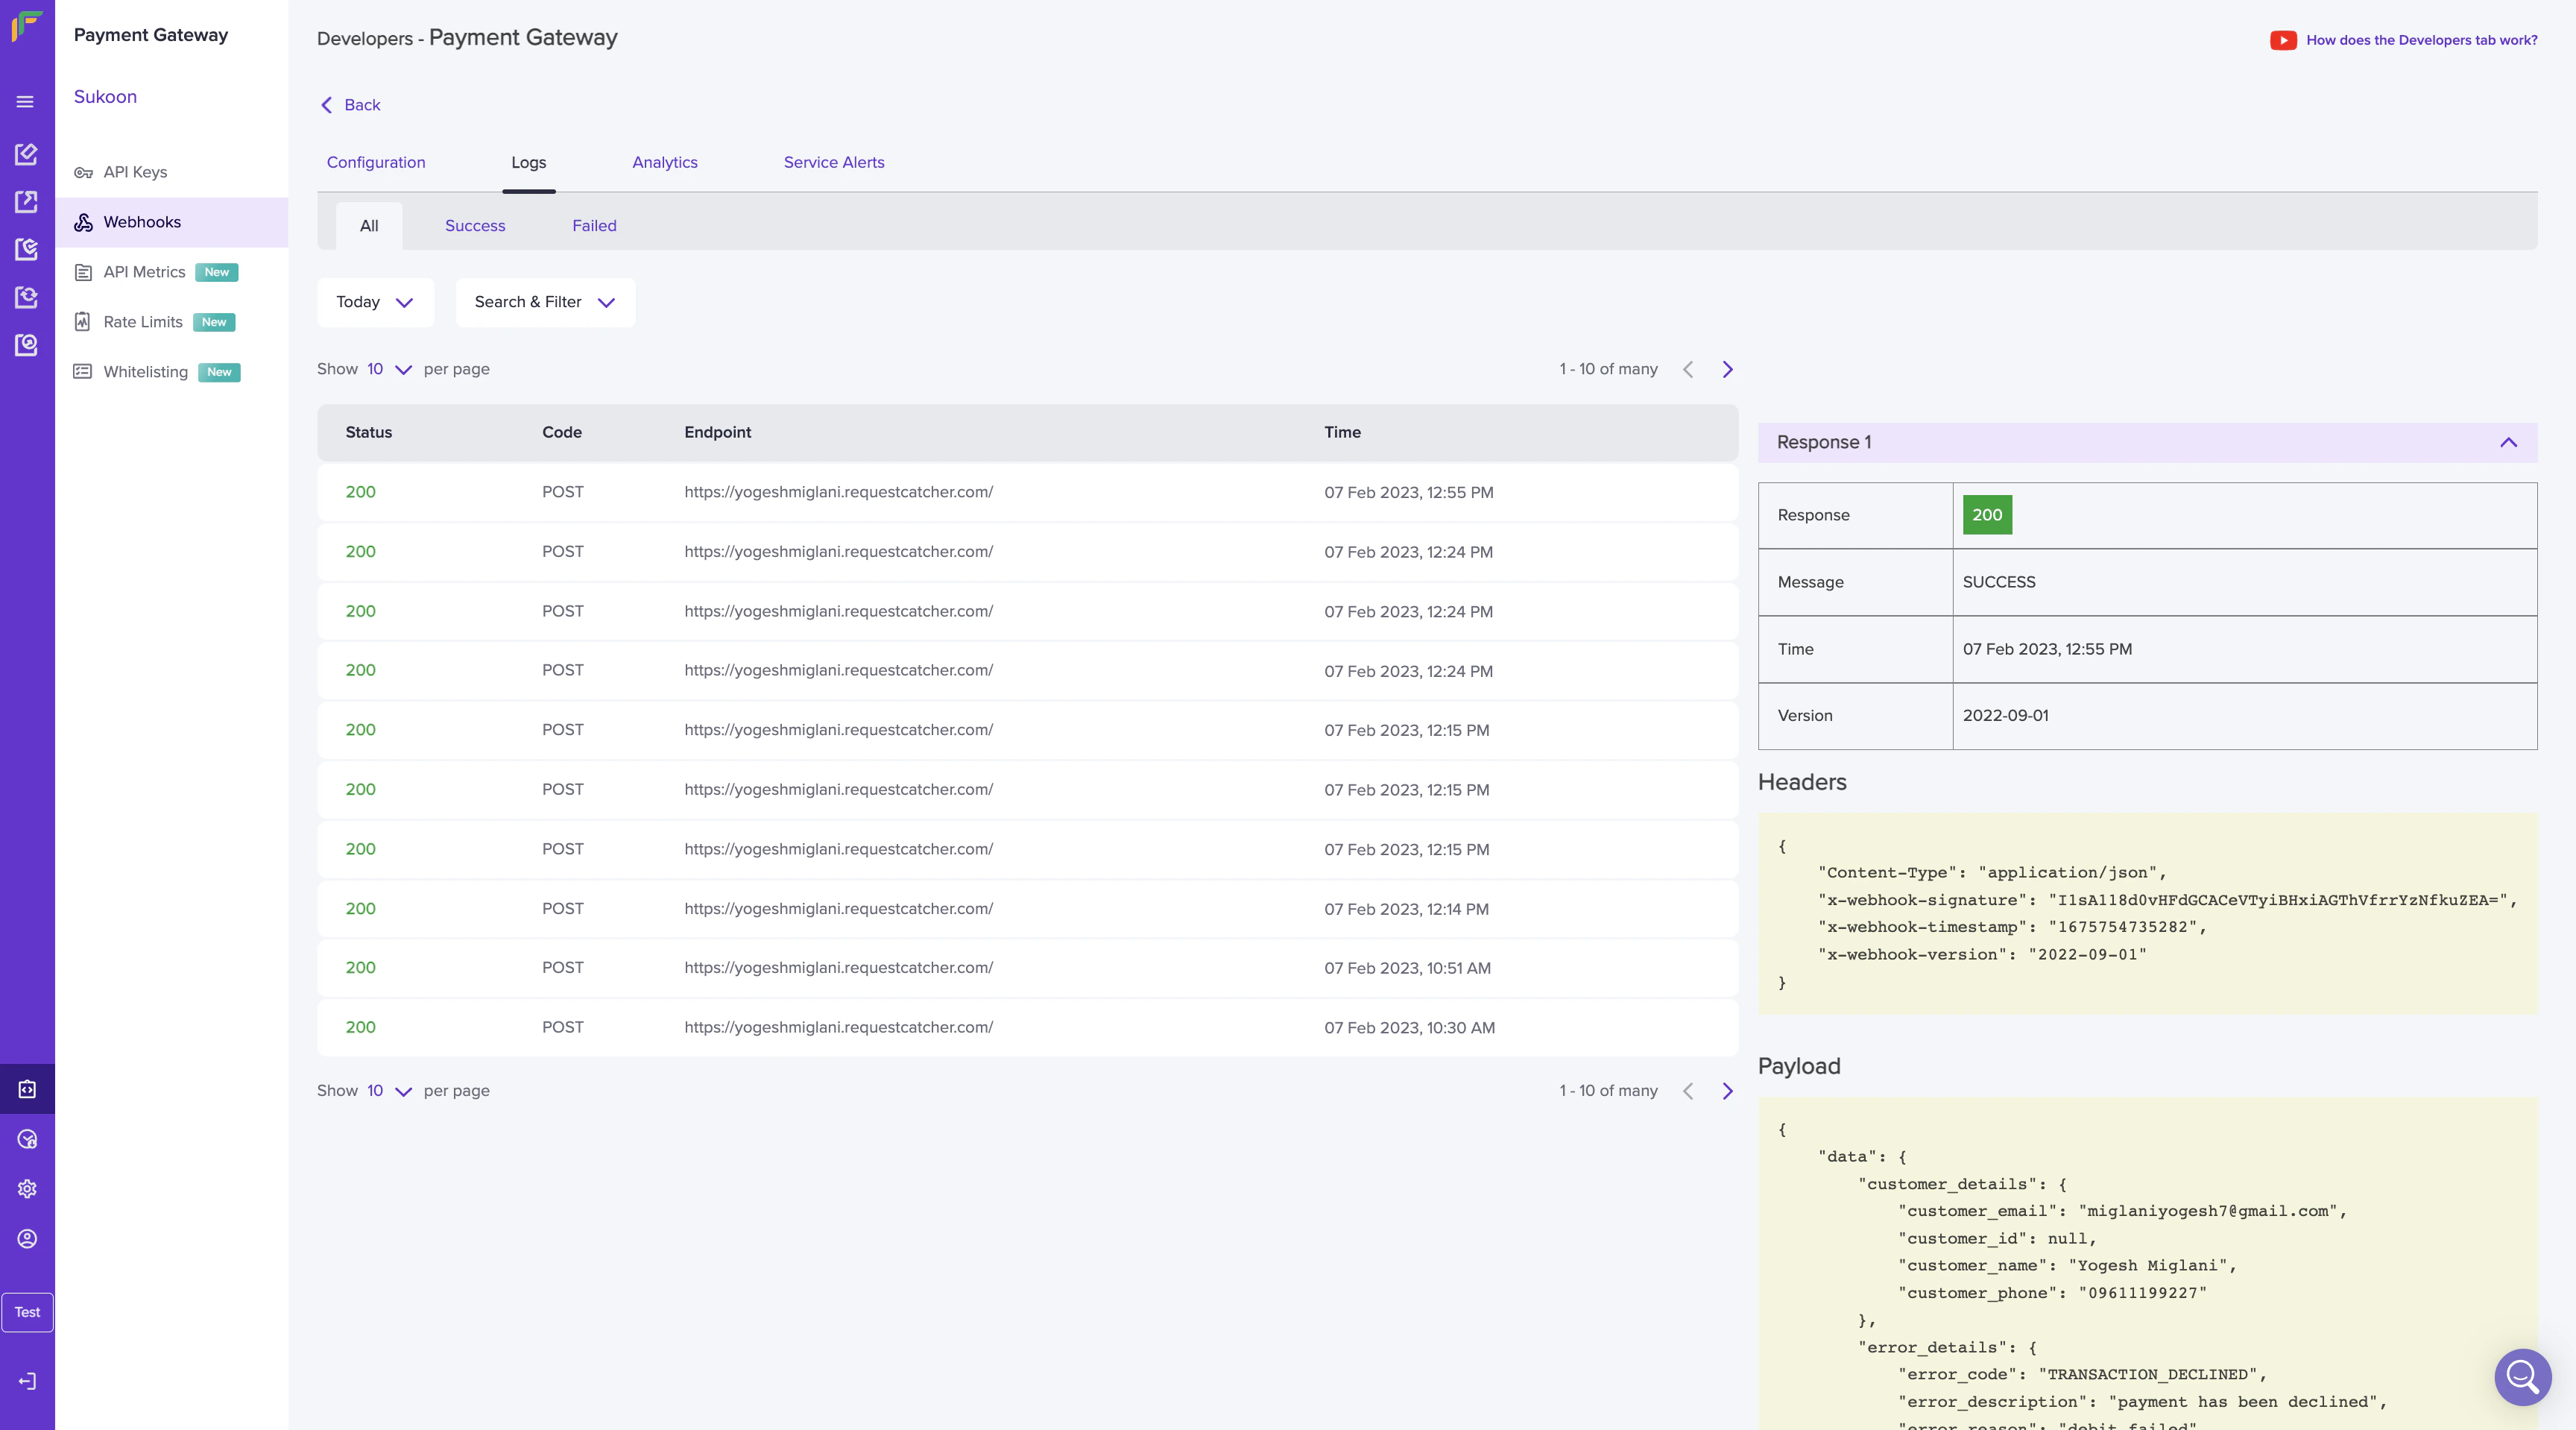
 ## Logs
The **Logs** section allows you to view all webhook logs(successful or failed) on your dashboard. Specify the date range to view logs for a particular period.
## Logs
The **Logs** section allows you to view all webhook logs(successful or failed) on your dashboard. Specify the date range to view logs for a particular period.
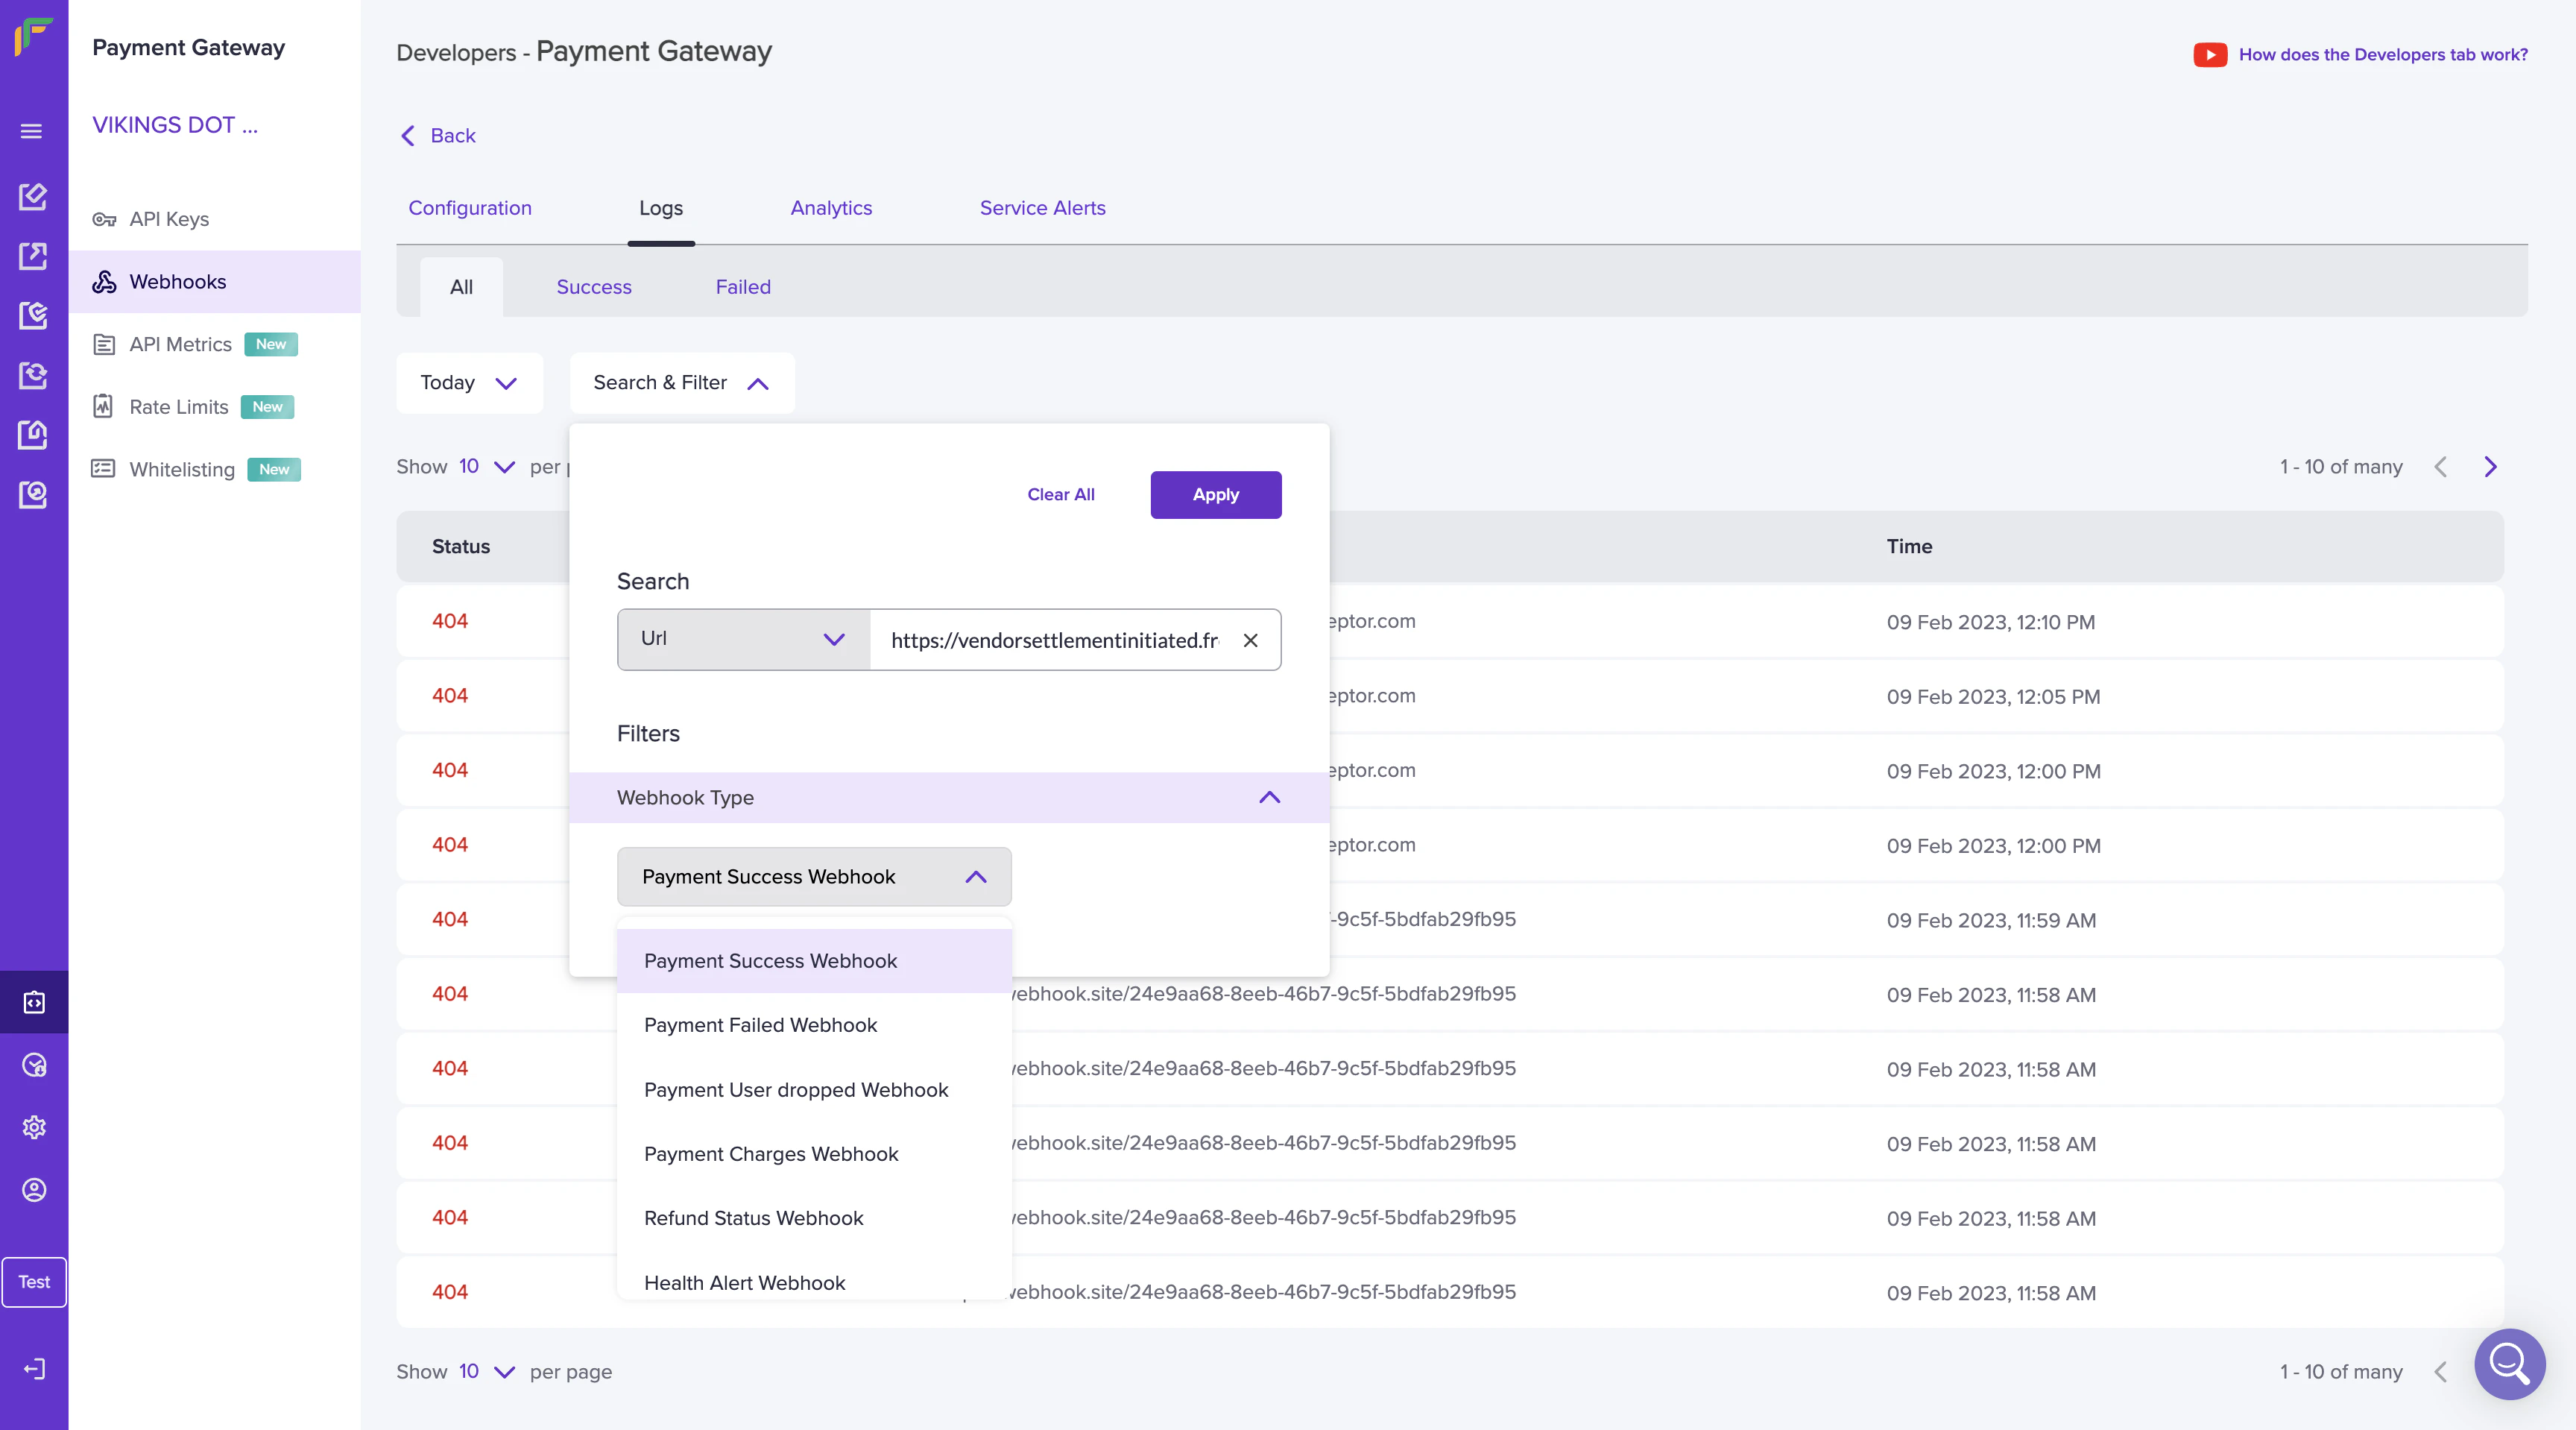
 Use the **Search & Filter** option to view specific logs. Enter the URL and select the required webhook type from the drop-down menu.
 Click on a particular request to view more details such as message, time, version, header details, and the payload. If you want to view success or failed logs, navigate to the respective tabs.
 Watch the video below to learn how logs work.
***
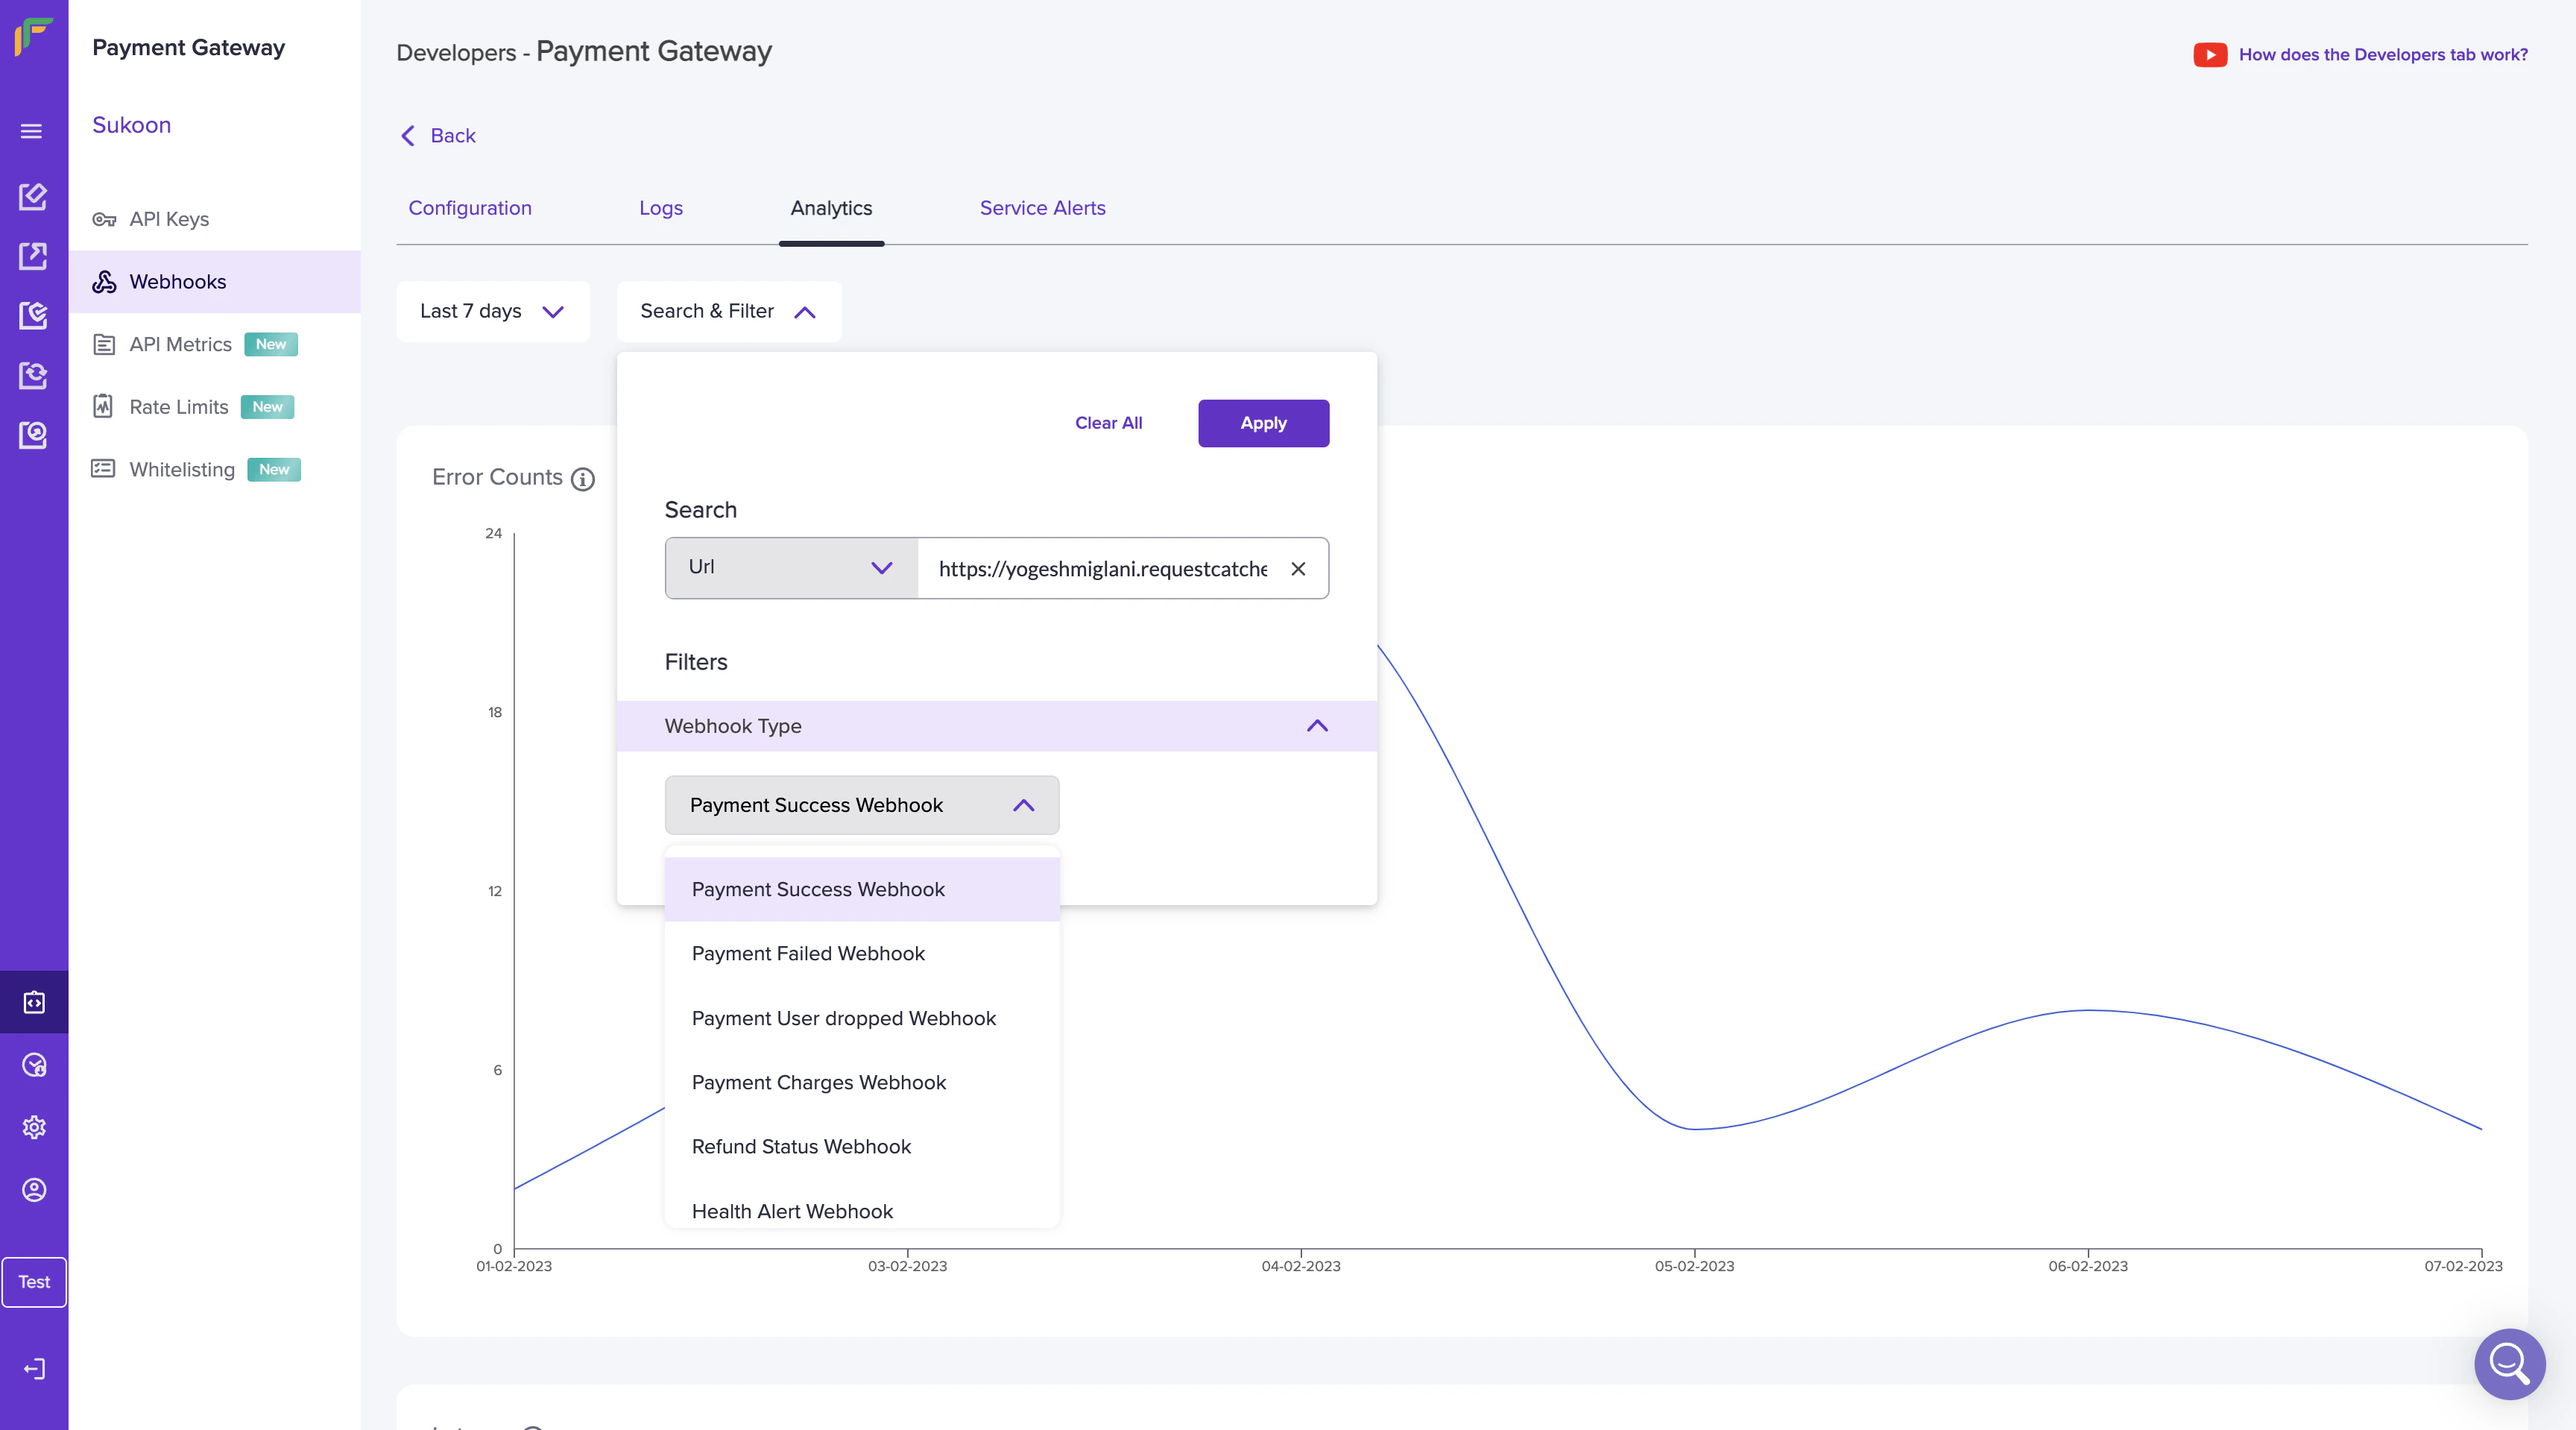
## Analytics
The webhook analytics feature provides you with contextual information on the webhook metrics that allow you to track, monitor, and assess the success or failure of your webhooks. Metrics such as Error Counts and Latency are available.
Specify the date range to view the metrics for a particular period. Use the **Search & Filter** option to view specific logs. Enter the URL and select the required webhook type from the drop-down menu.
Watch the video below to learn how logs work.
***
## Analytics
The webhook analytics feature provides you with contextual information on the webhook metrics that allow you to track, monitor, and assess the success or failure of your webhooks. Metrics such as Error Counts and Latency are available.
Specify the date range to view the metrics for a particular period. Use the **Search & Filter** option to view specific logs. Enter the URL and select the required webhook type from the drop-down menu.
 ***
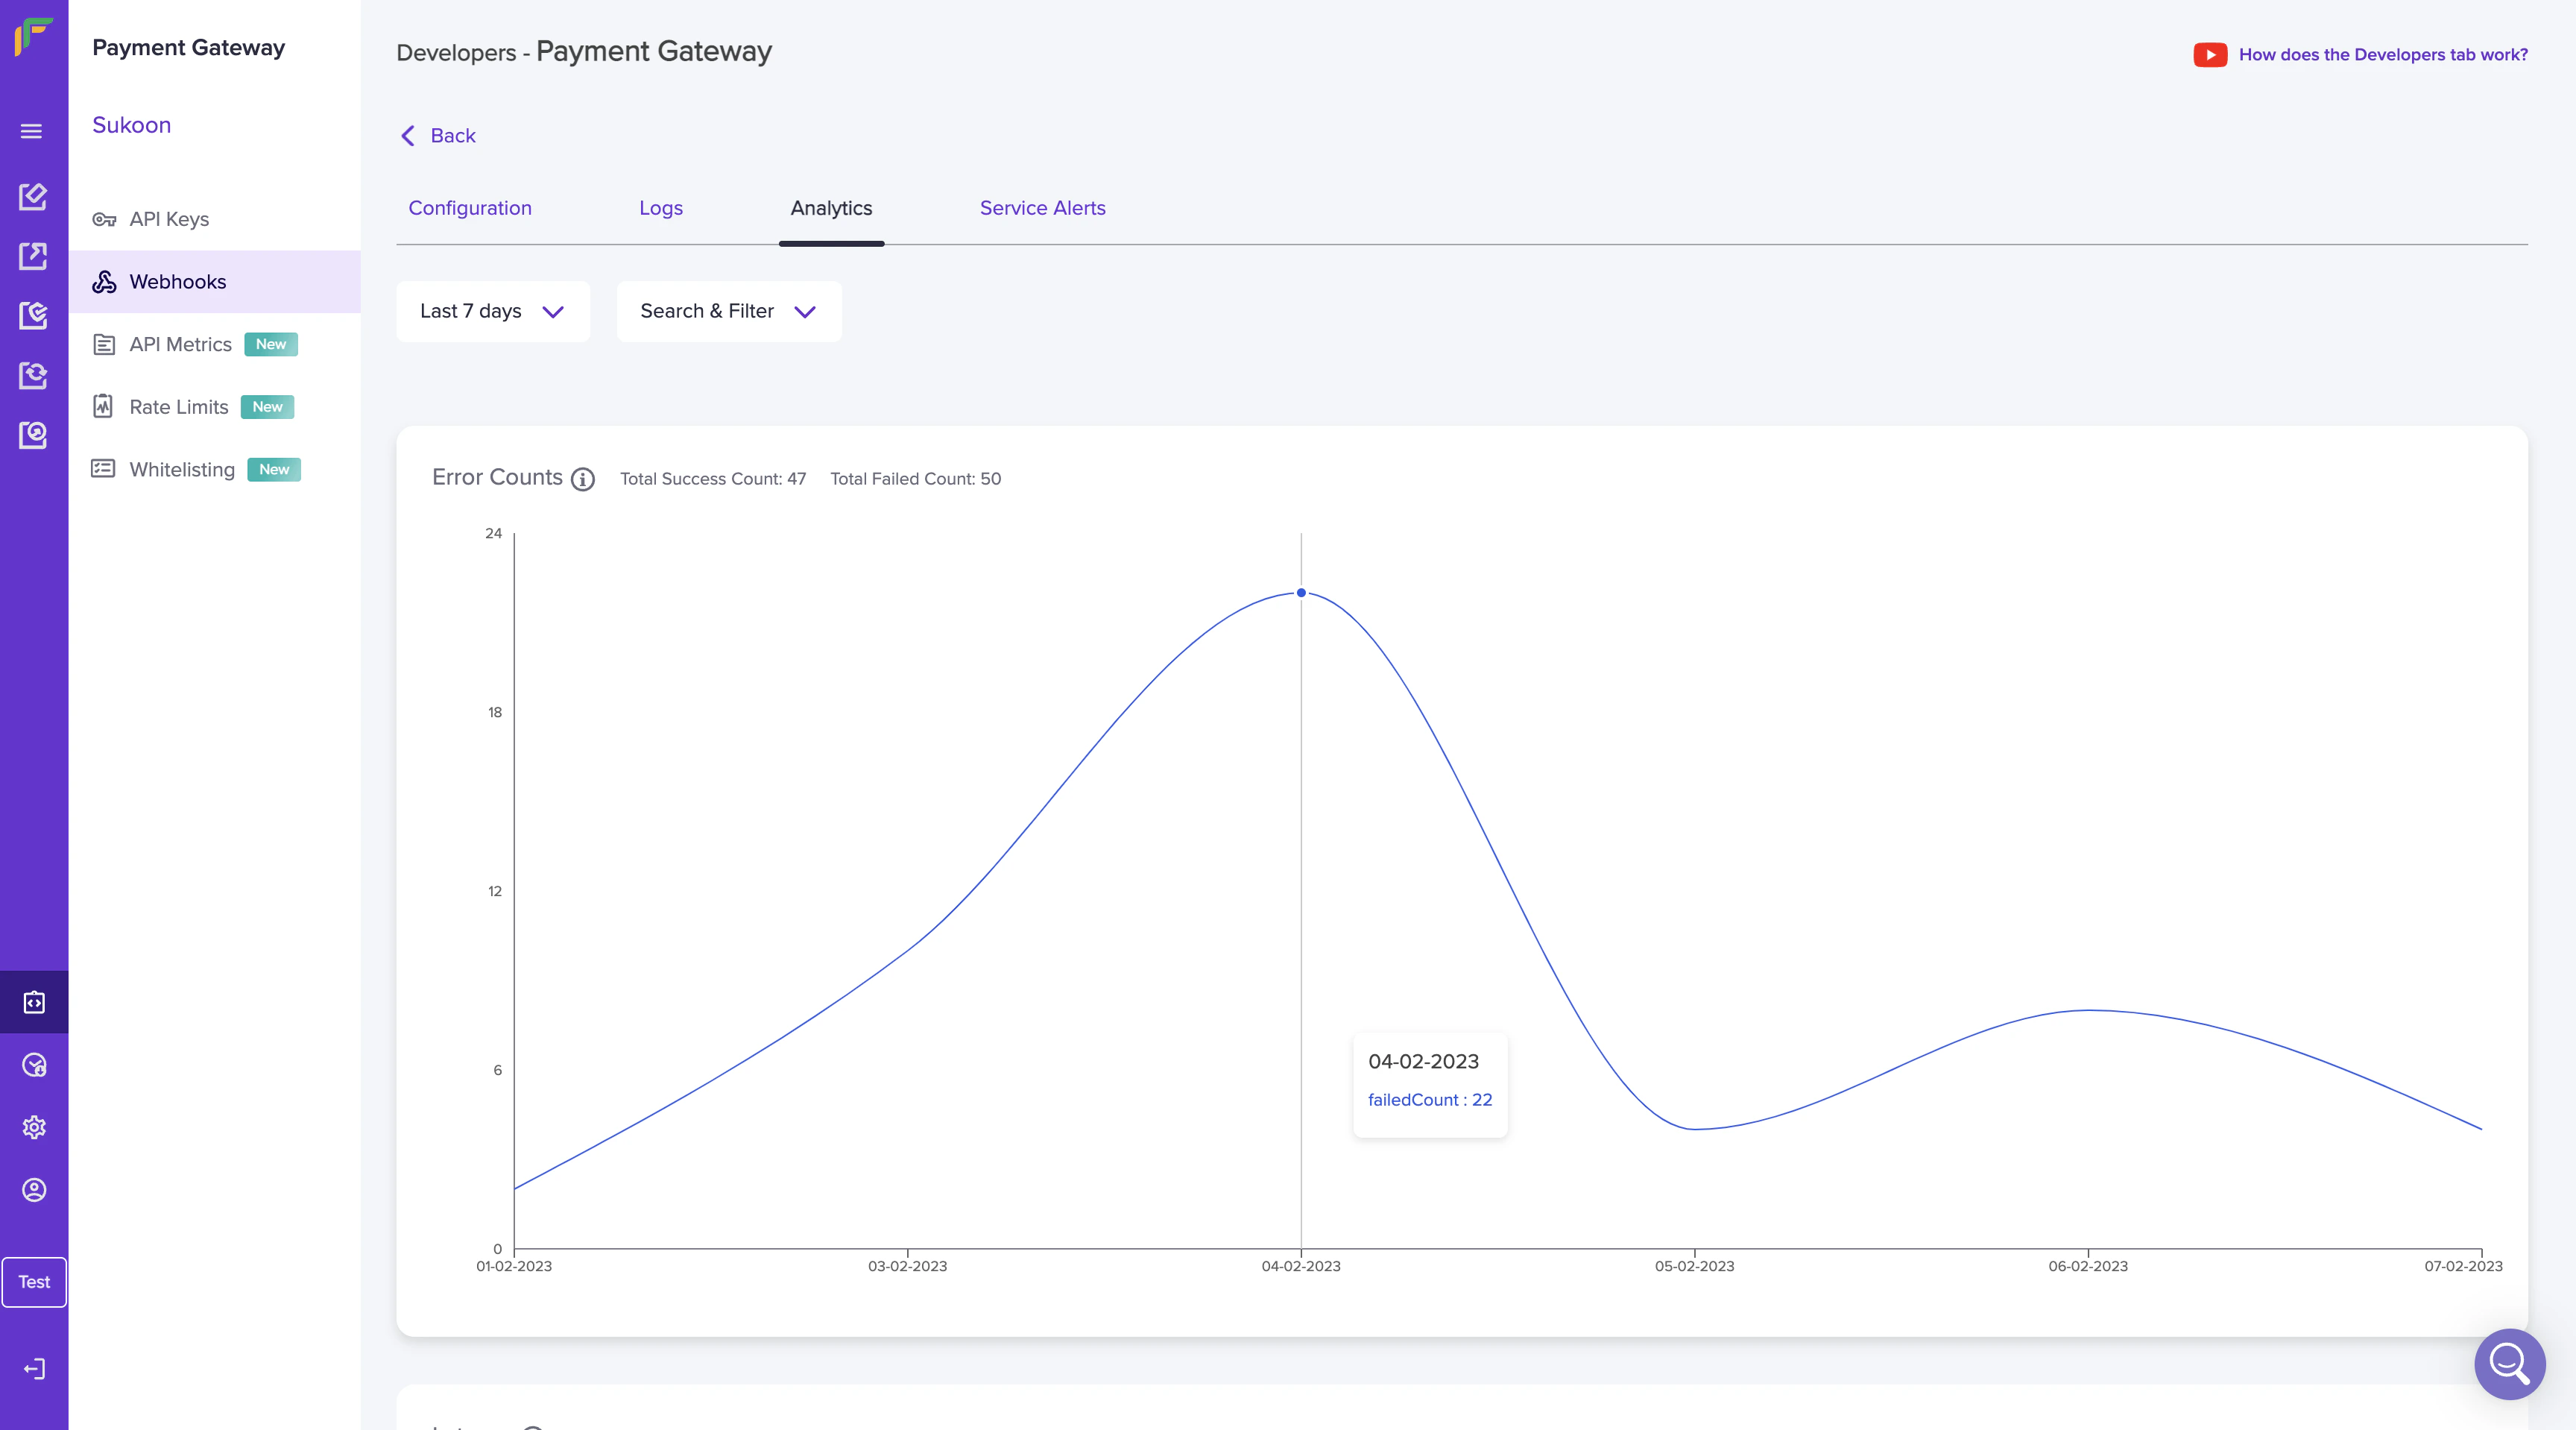
### Error count
An error count is the count of the different errors received when sending webhooks. Metrics such as the total success count and total failed count are visible. Hover your mouse over the individual date to view the success or failed count.
***
### Error count
An error count is the count of the different errors received when sending webhooks. Metrics such as the total success count and total failed count are visible. Hover your mouse over the individual date to view the success or failed count.
 ***
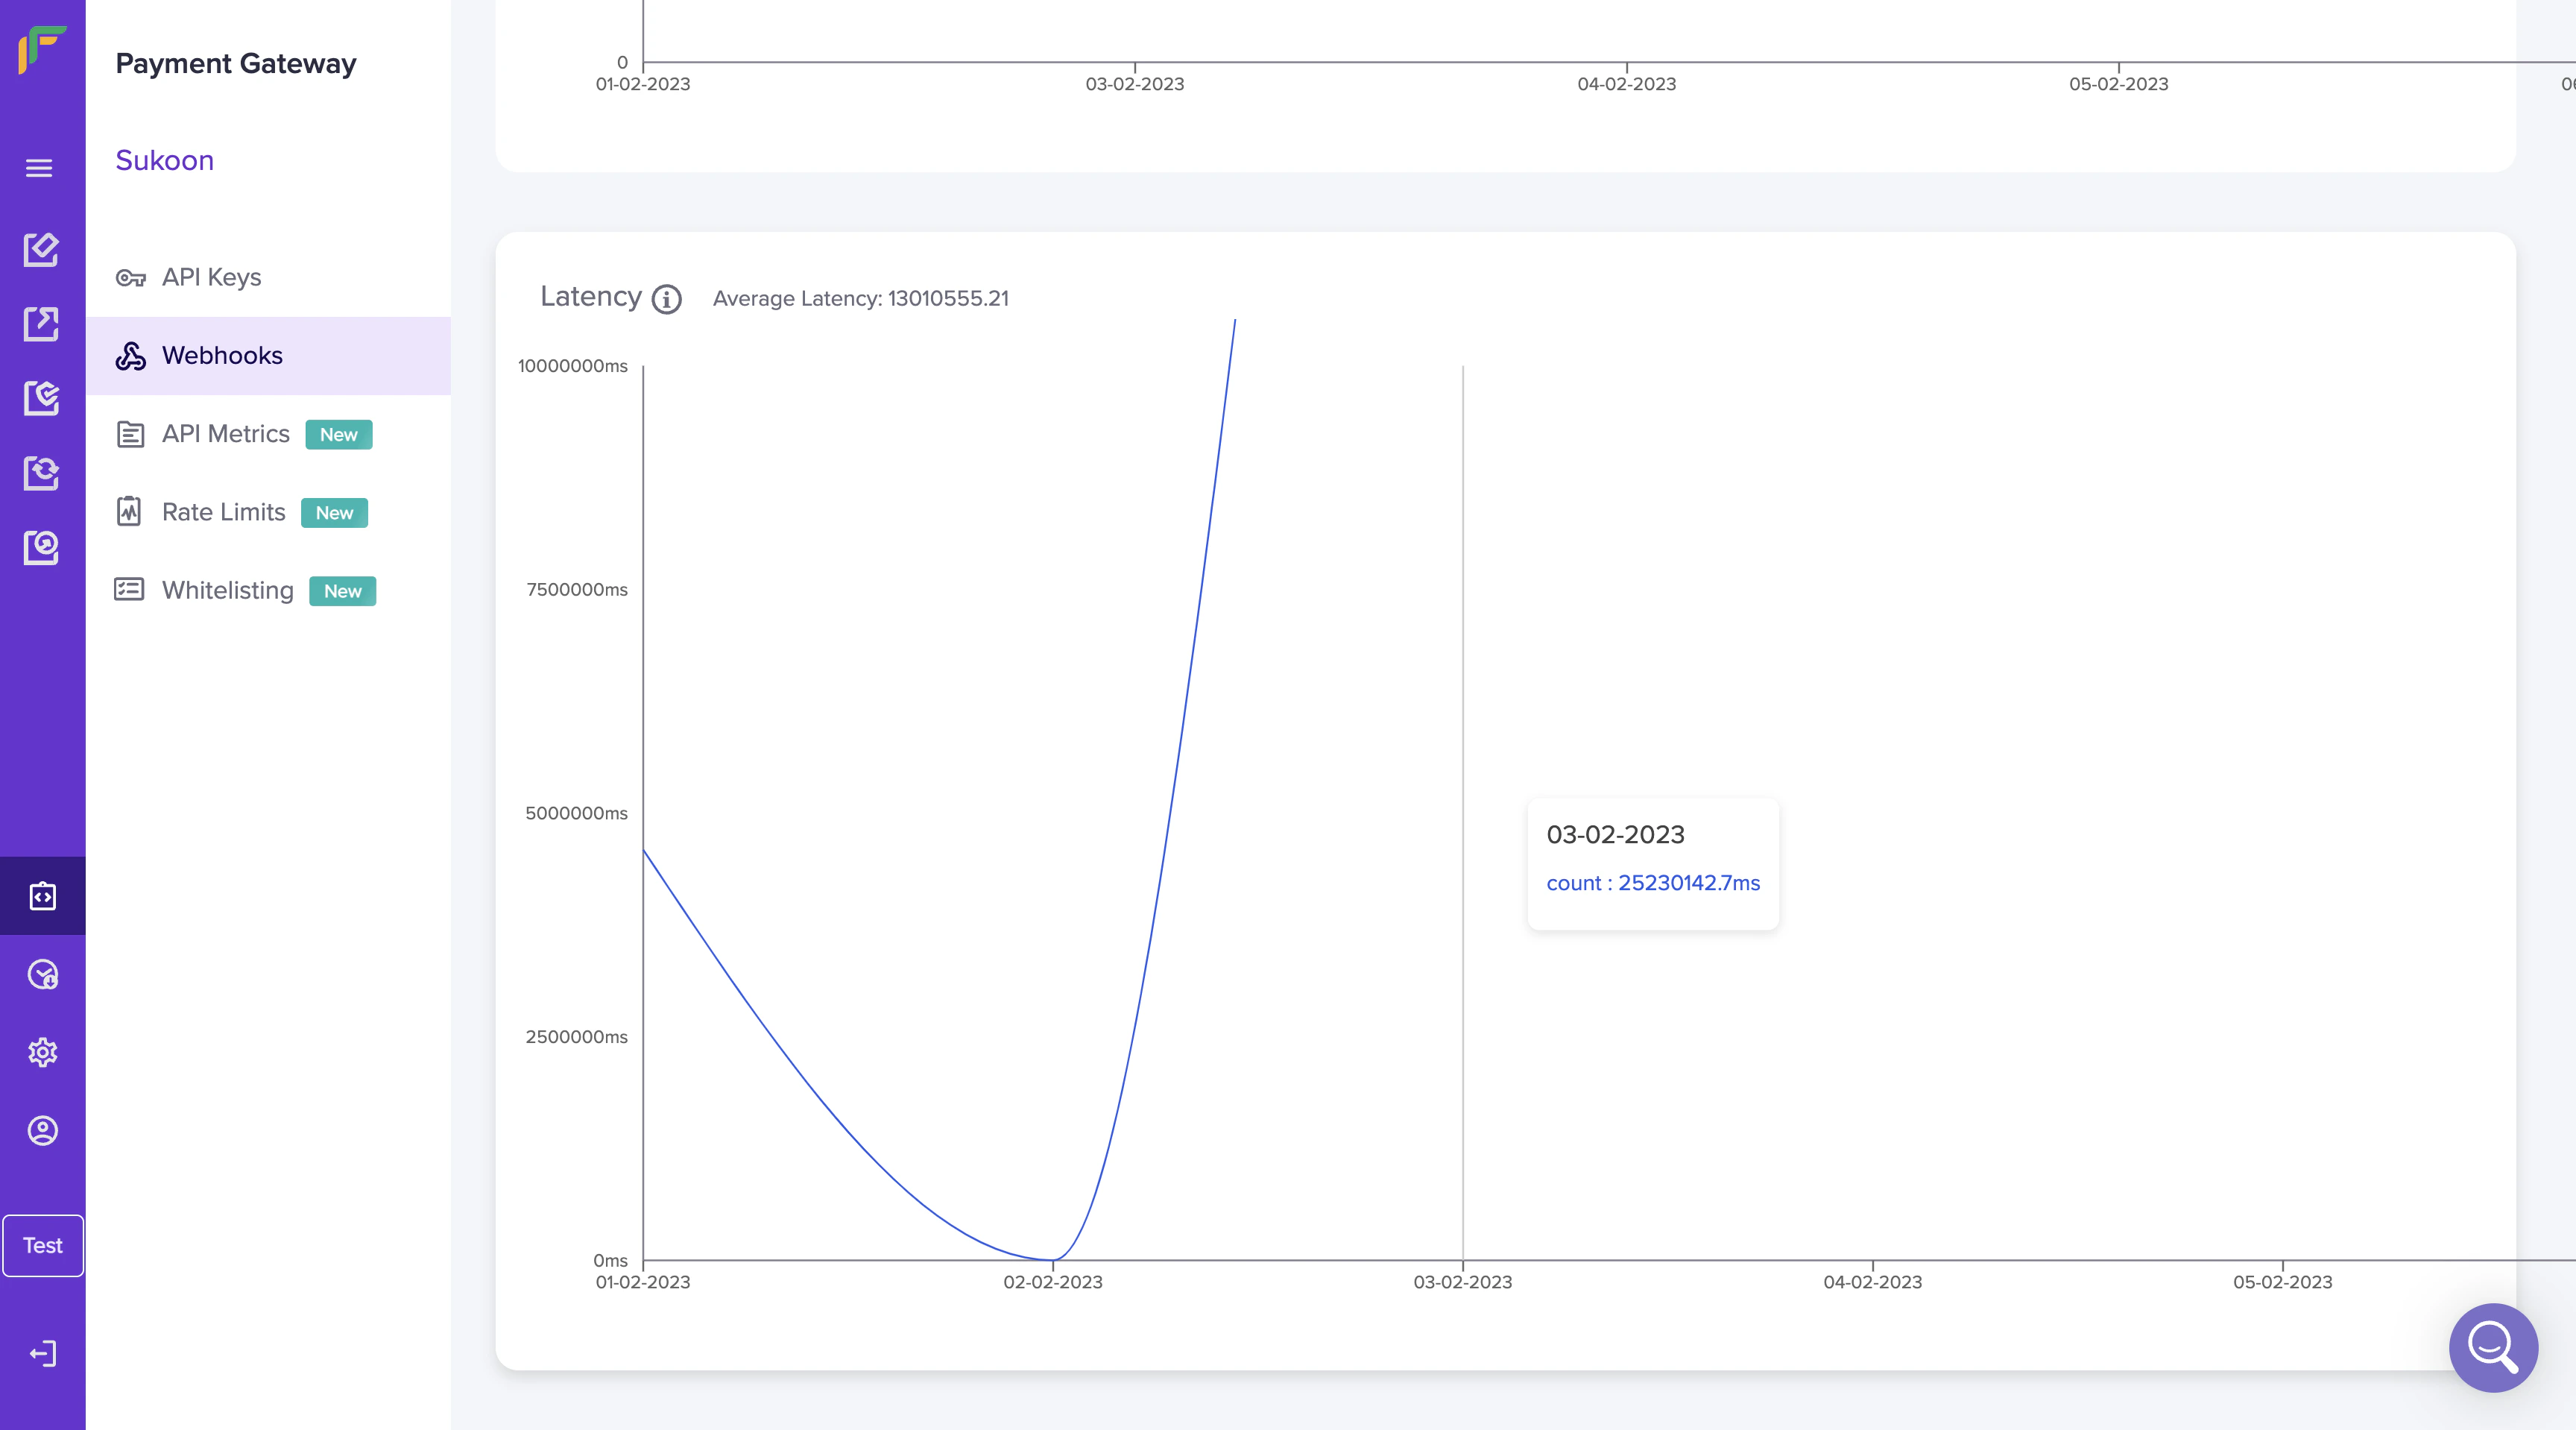
### Latency
Latency is the time taken to respond to webhooks. Hover your mouse over the individual date to view the latency count. The average latency value is also provided.
***
### Latency
Latency is the time taken to respond to webhooks. Hover your mouse over the individual date to view the latency count. The average latency value is also provided.
 ***
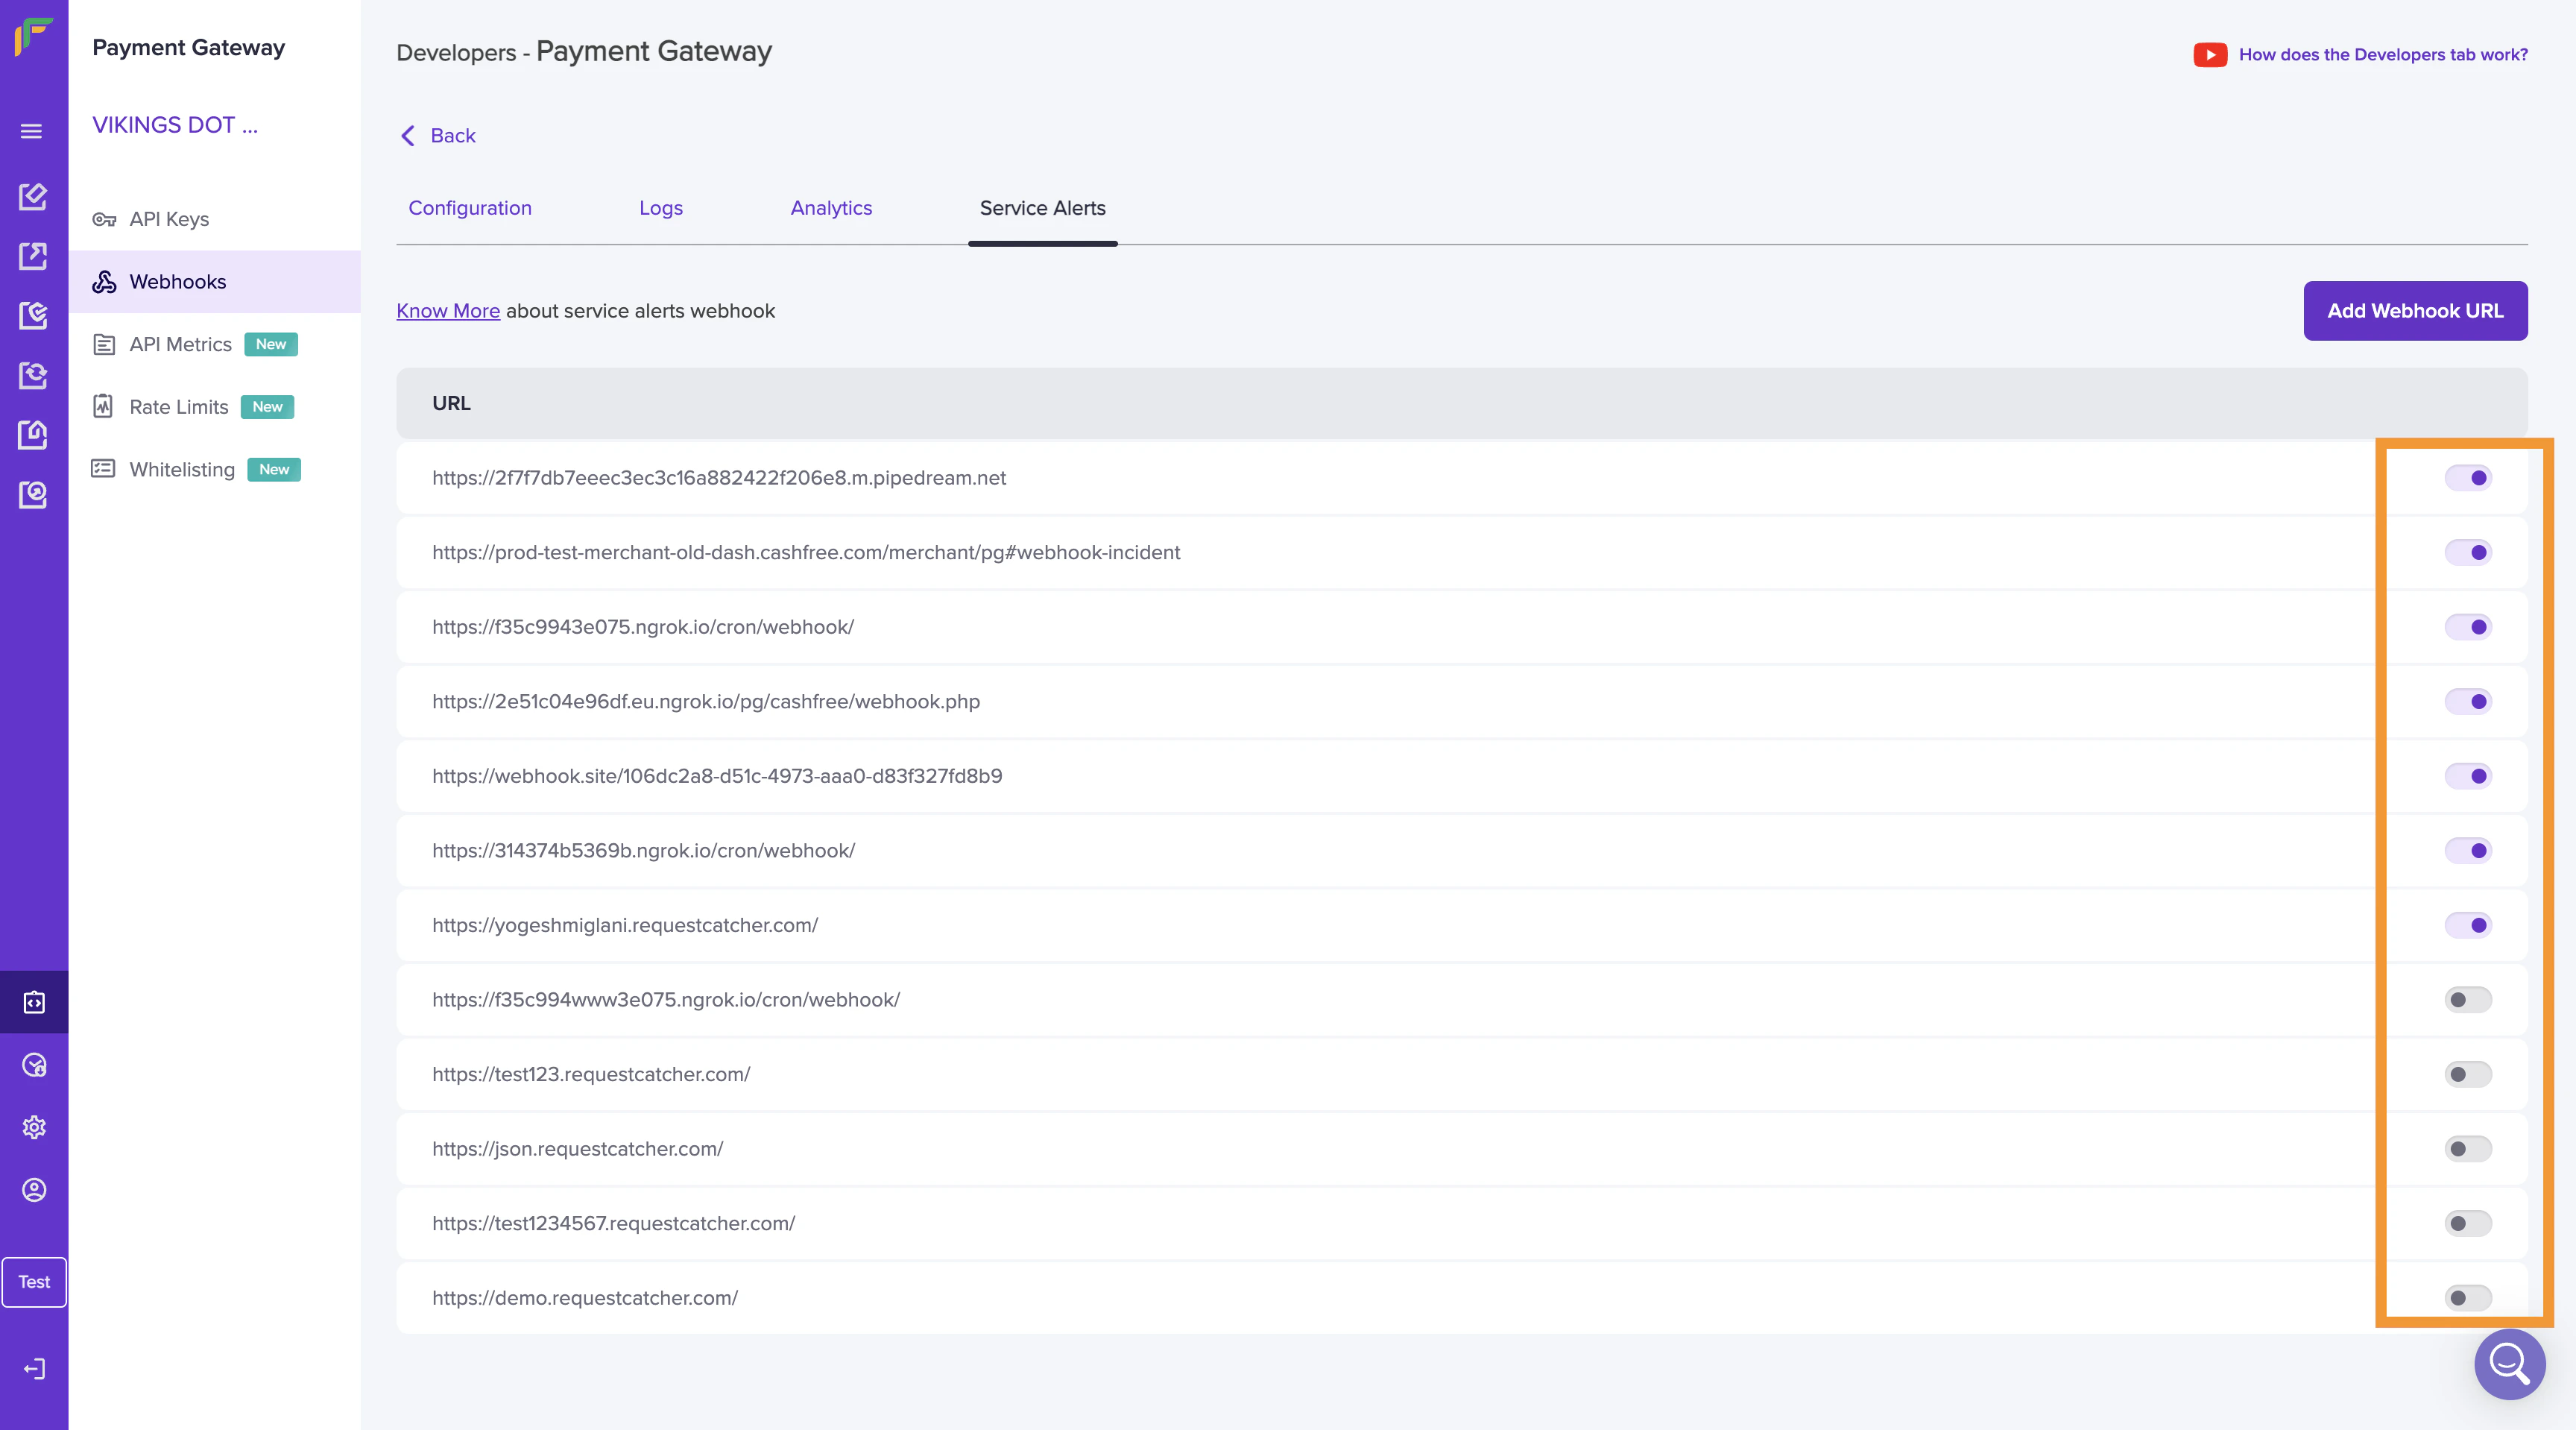
## Service alerts
The **Service Alerts** tab allows you to:
* Add webhook URL
* Activate or deactivate webhooks
To add a new webhook,
1. Go to Payment Gateway Dashboard > **Developers** > **Service Alerts**,
2. Click **Add Webhook URL** and specify a valid webhook URL.
***
## Service alerts
The **Service Alerts** tab allows you to:
* Add webhook URL
* Activate or deactivate webhooks
To add a new webhook,
1. Go to Payment Gateway Dashboard > **Developers** > **Service Alerts**,
2. Click **Add Webhook URL** and specify a valid webhook URL.
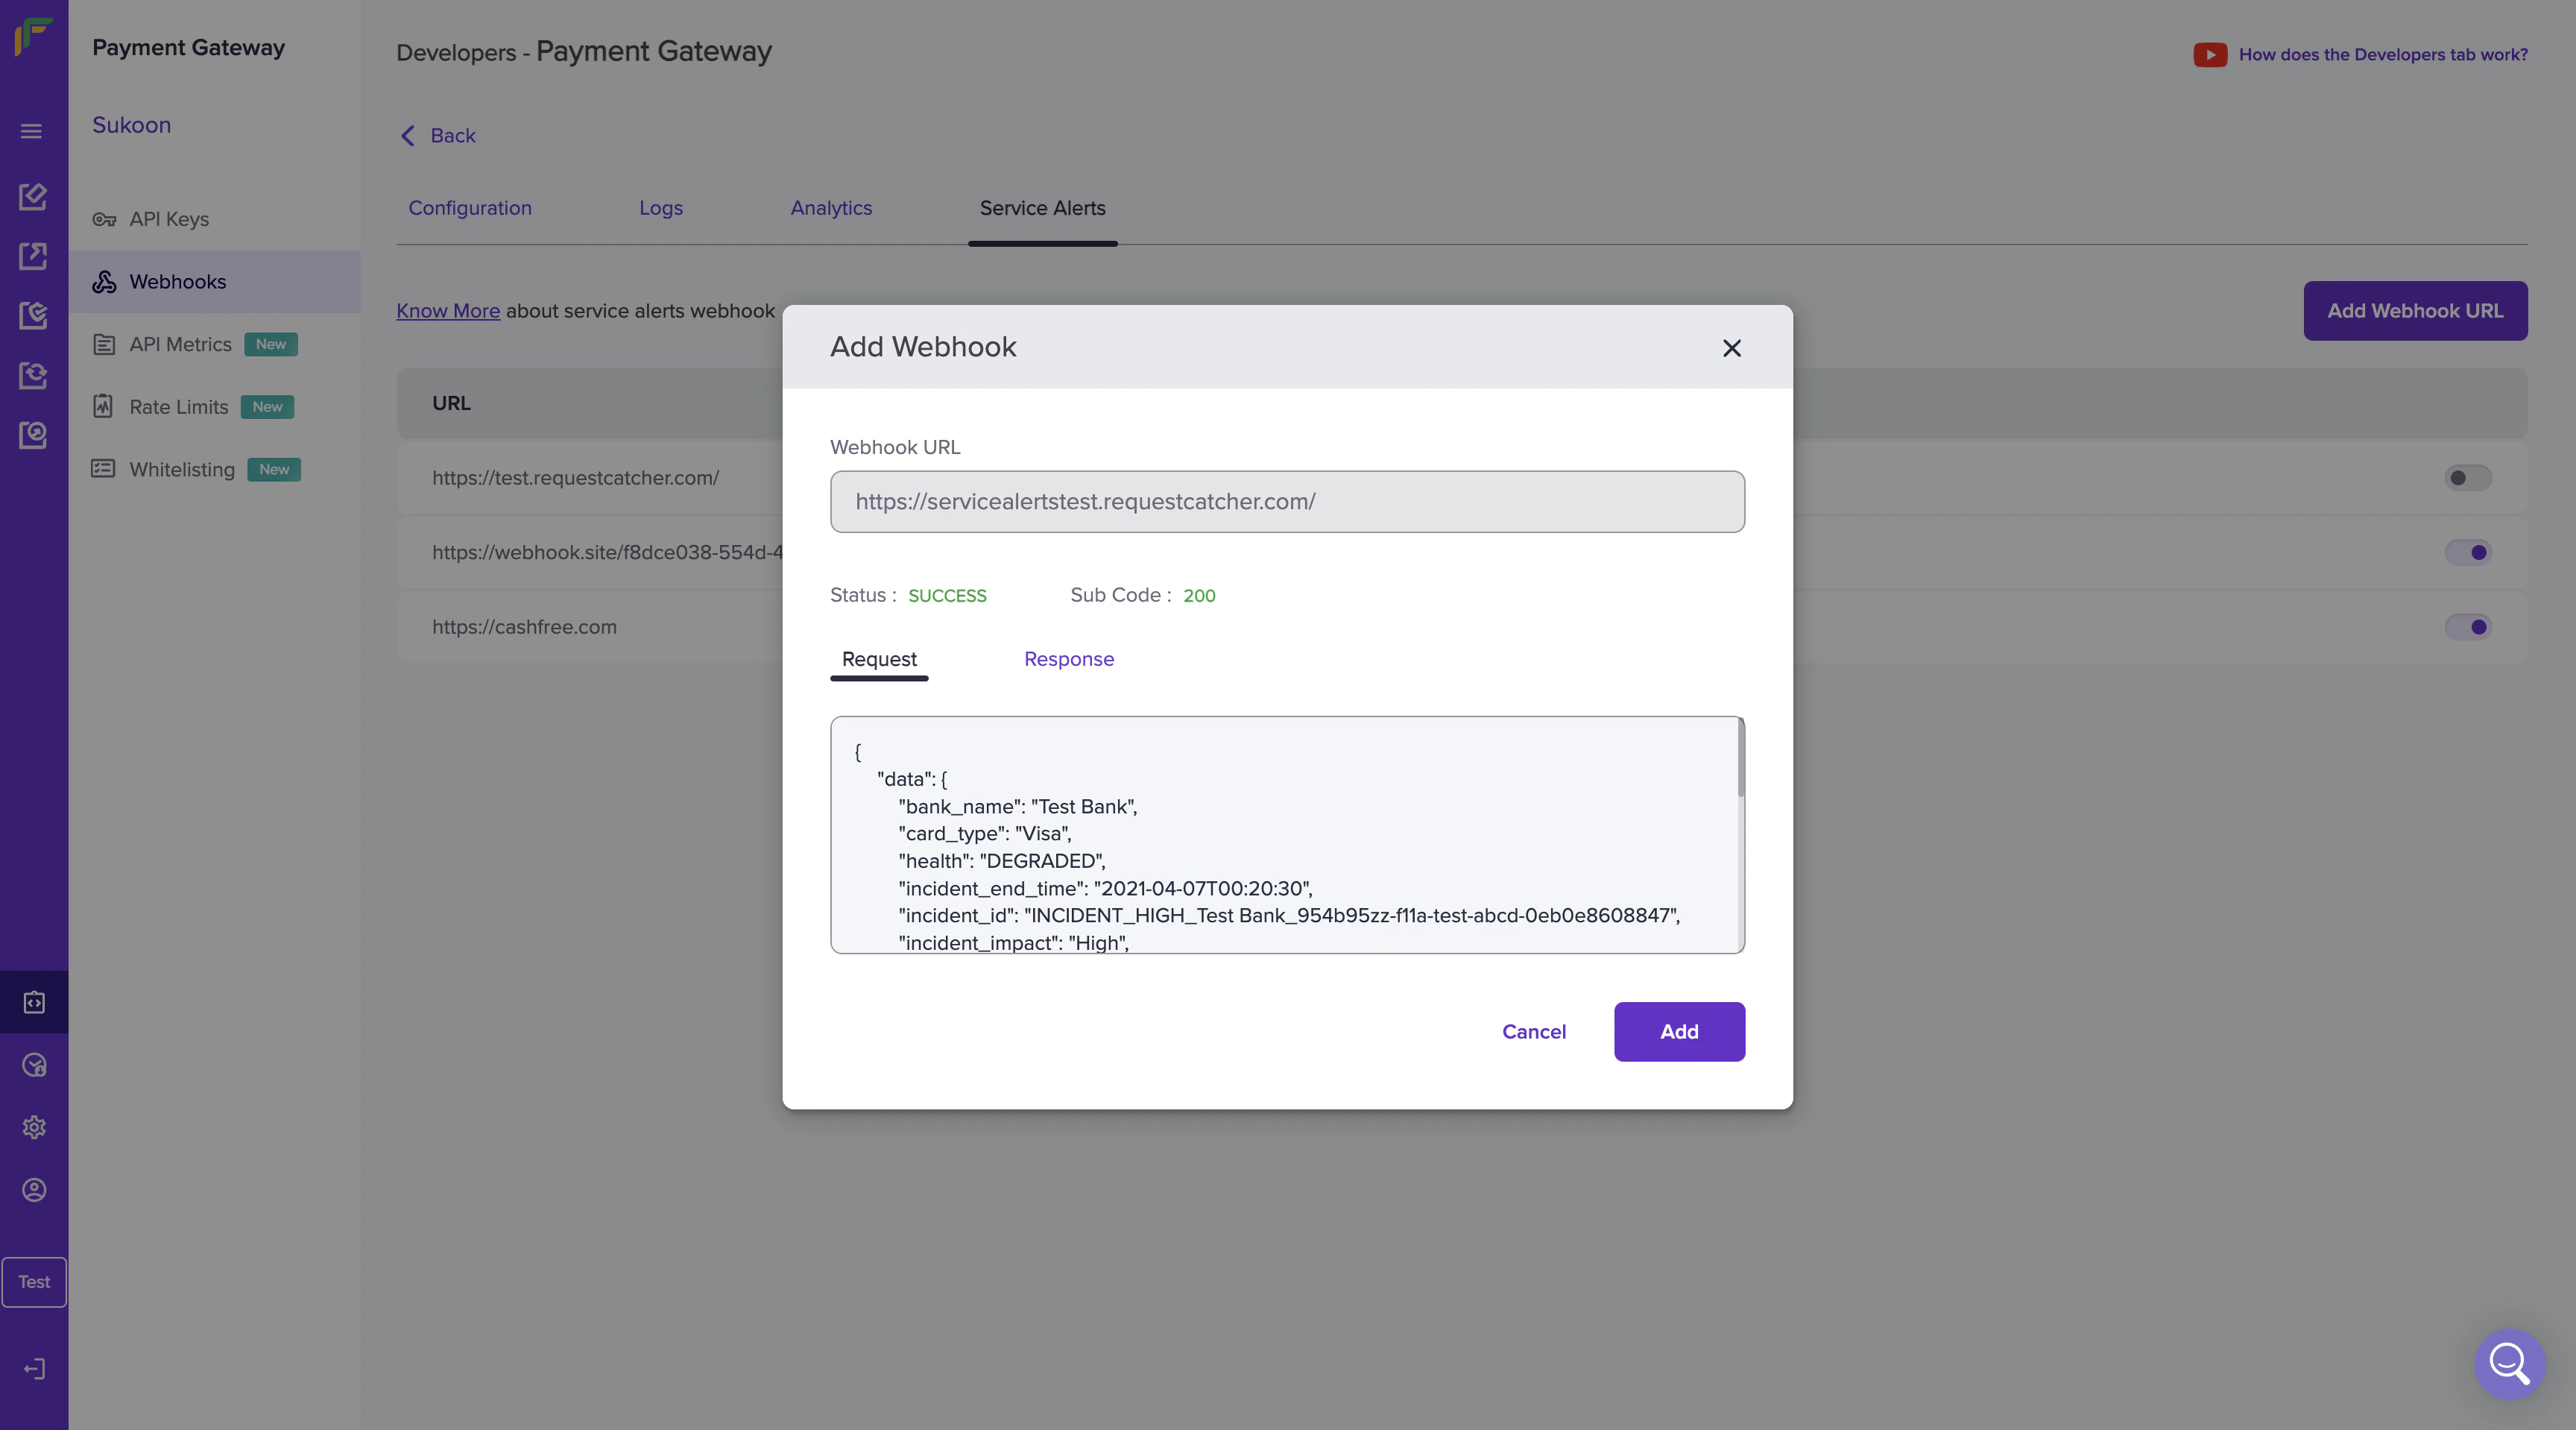
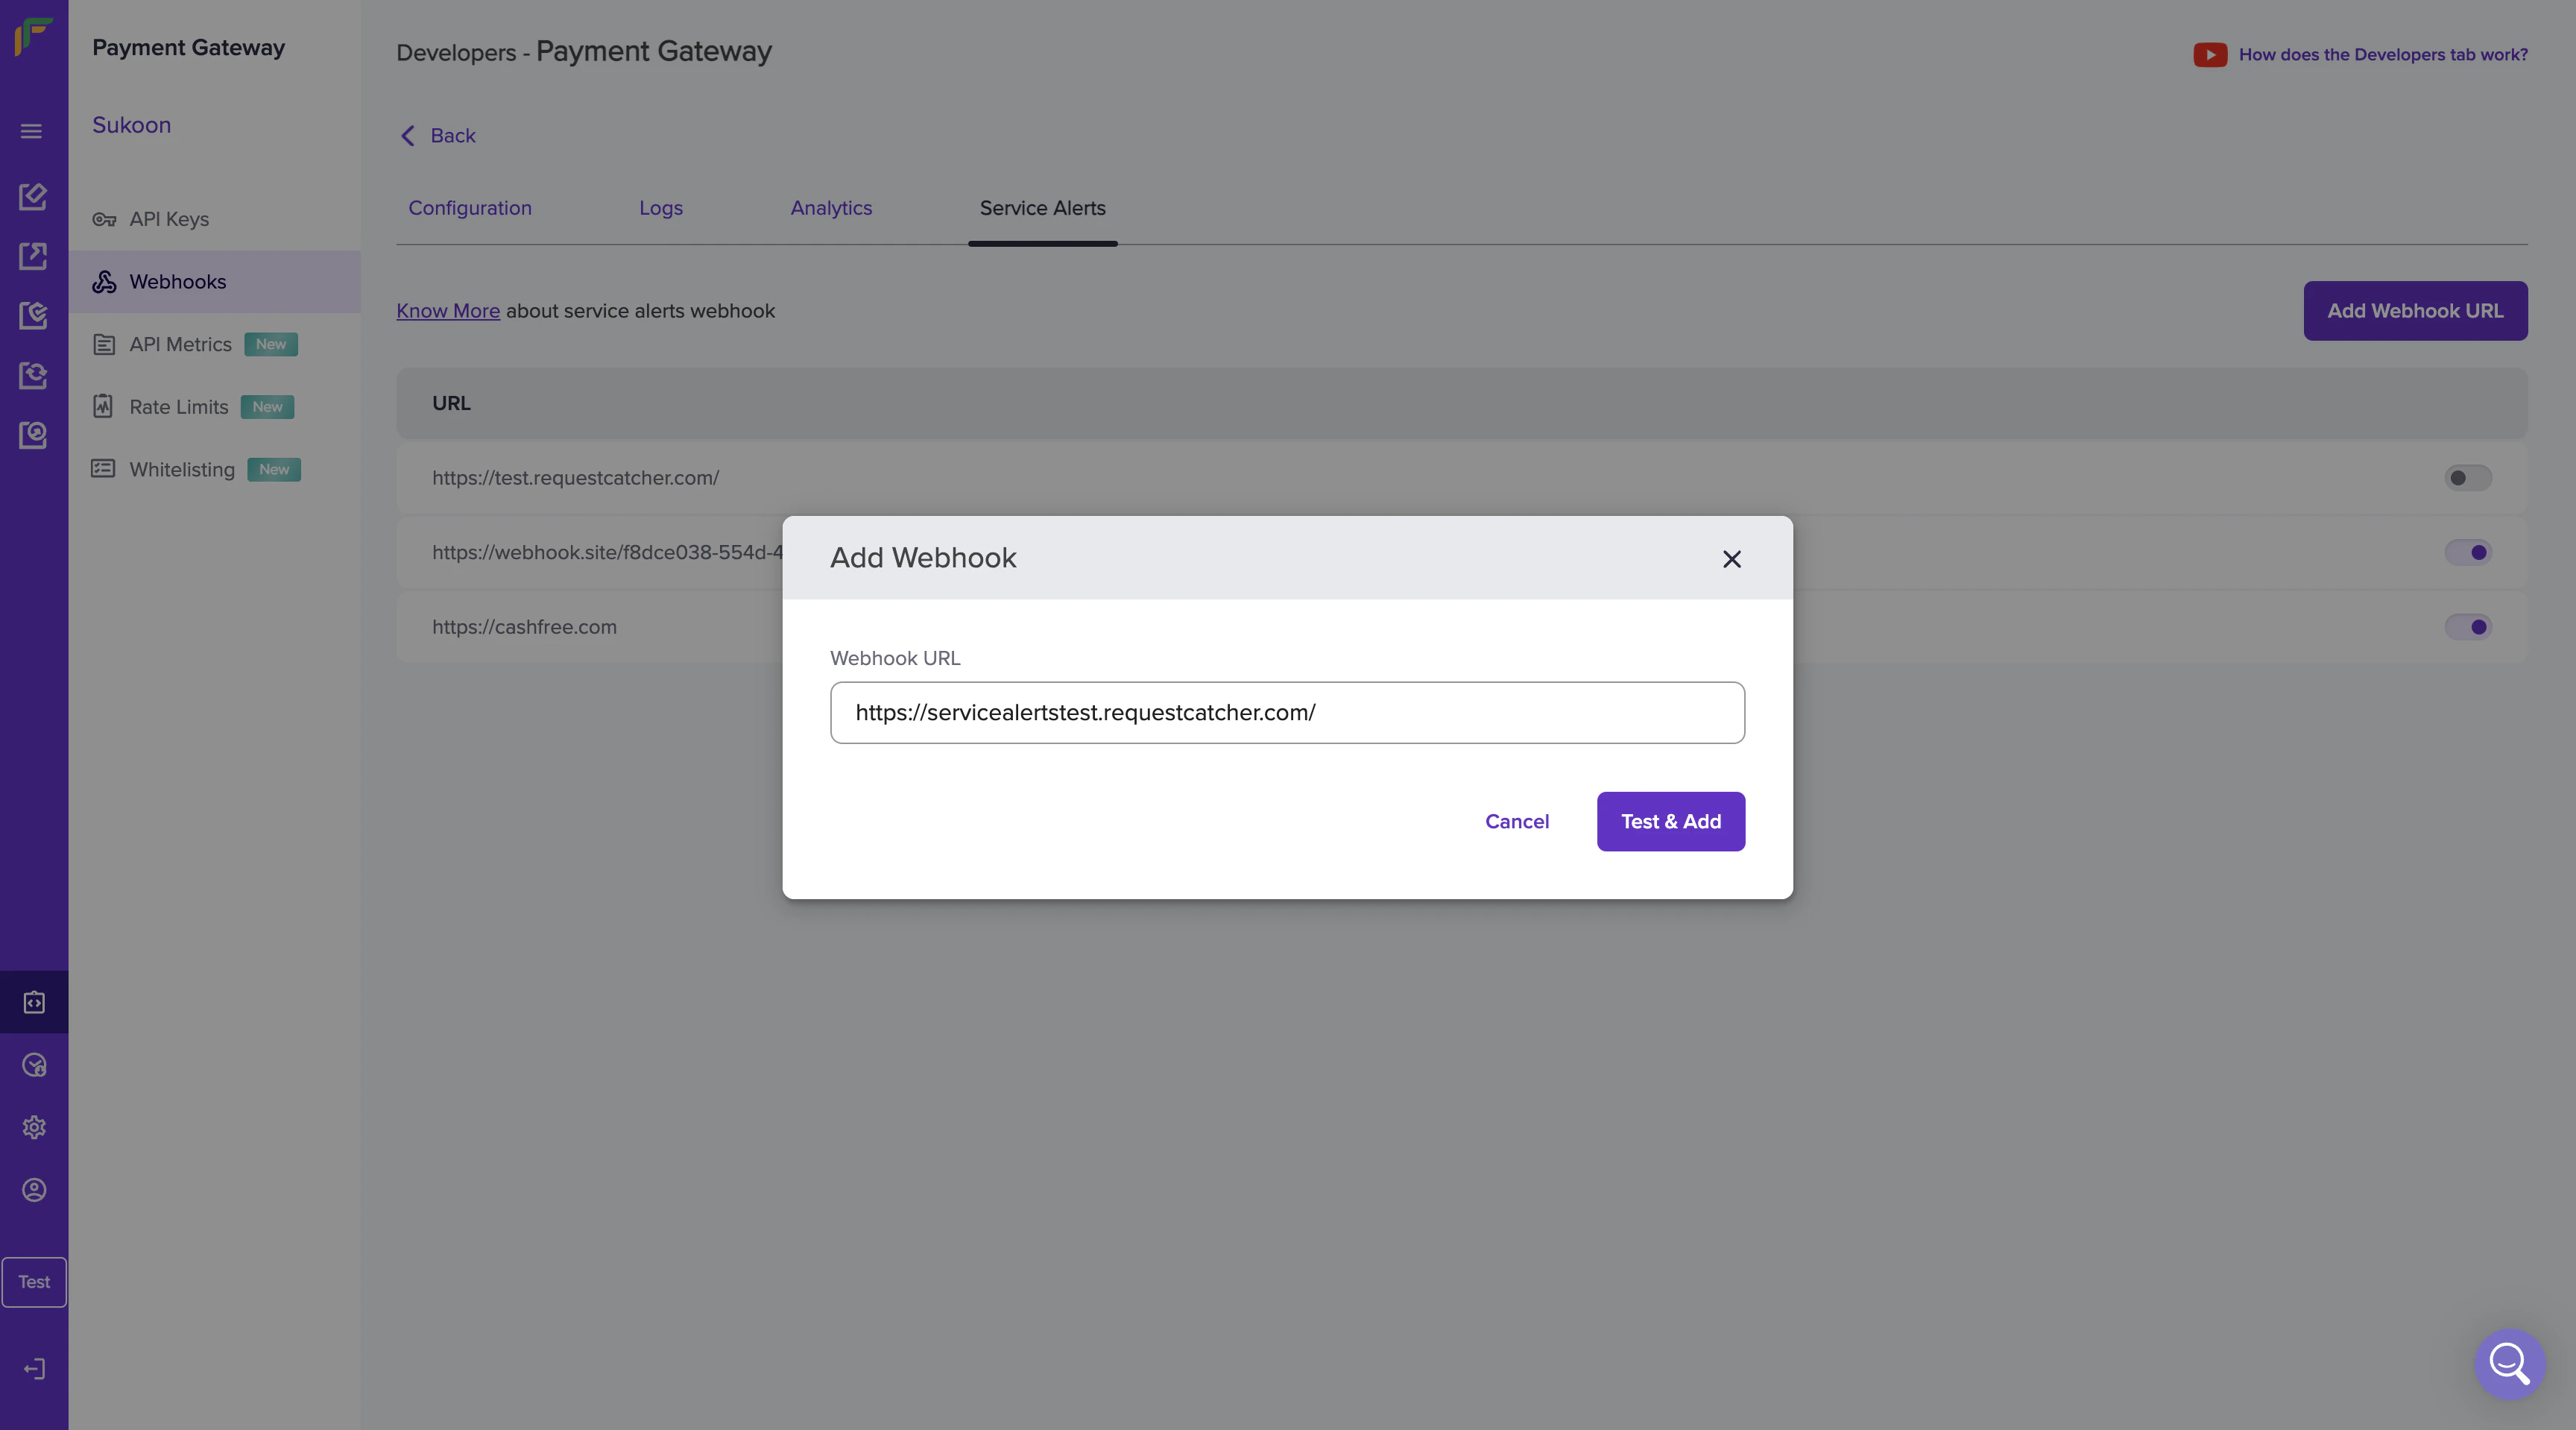 3. Click **Test & Add** to save the webhook URL. Review your selections and click **Add**. The webhook is added successfully.
 To activate or de-activate a webhook URL, use the toggle button beside the corresponding webhook.